Australian( SPI) Index Weekly 28th June 2008

CNBC is now alerting that US markets are nearly in a 'BEAR' Market, but in fact that BEAR market began at the start of the January 2008, as prices pushed down from the Yearly 50% levels.

As previously mentioned many times, the counter-trend UP into MAY from March lows would be the time to go cash, as the expectation that all global markets would be moving down toward the lows once again, and continue lower July-Sept as price push down towards their Yearly lows for 2008 ......


Aussie index XJO Cash market

Yearly lows are 4538 and the expectation is that the market will move that low, and probably in the next Quarter.

Ever since the 'crash' pattern began in January the market was heading down into 4538, but only after the 2-month counter-trend move from March Low back into the May's highs, had completed, and the expectation of further weakness down.

SPI Weekly Futures

Ideally I want to be moving back into Financials, but I'm not expecting any counter-trend move greater than the higher timeframe 50% levels.

That reversal upwards can occur from July's lows, but then the expectation is further weakness down into the Yearly lows.

Note:- As previously mentioned many times before, even though the 2008 lows might support the market this year, I'm expectating lower prices in 2009, where once those lower levels are reached we should bottom out this bear market, but I'll come back to that next year.

Dilernia Principle:- two timeframe waves pattern based on the Yearly timeframe

SPI Daily

Expectation SPI is continuing down, which could occur from the Weekly 50% level, or prices could push upwards into July's 50% level before continuing down.

But as a Day-trader on Index futures, I'm not concerned about which price action takes place....

SPI 5-day pattern and 44 point ranges.

Because I'm trading short-term 5-day patterns using the 5-day filter and spiral-point trading..

But waiting for the right price action to re-enter stocks looking for the next Counter-trend move back up into the monthly 50% level and where I'll go cash once again, before the next downward move into 4538......


  • Daily Trading Set-ups & Analysis
  • Index Futures SPI, DOW S&P, & Forex
  • Subscribe to the Trader Premium
  • http://www.datafeeds.com.au/premiumtrader.html


  • SPI Australian Index Weekly 21st June 2008

    SPI Weekly

    It's not often the Index markets drop lower the week of expiry of contracts, more often than not prices rise up into expiry and then continue lower if the overall pattern favours that move. The pattern I was looking was a move up into July's 50% level and then continue lower next month or after contract expiry.

    But as the saying goes...."same,same but different".... the view of lower prices was going to occur once prices topped out in MAY, but whether it goes lower in June or July it's not all that important, because i'm not ready to move into stocks just yet looking for the next monthly counter-trend move upwards.

    That will occur on the next double monthly low pattern, which more than likely looks to be occurring in July where once again i'll be moving back into Financial stocks.

    As pointed out in the Stock Report:- I've already noted where my BUY levels are on all 4 banks.

    http://aussie-stocks.blogspot.com/

    SPI Daily

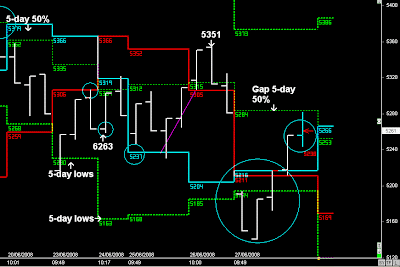
    Therefore the view is for prices to move down into June's lows @ 5100, and then continue lower into July's low.

    SPI daily and 5-day pattern

    Last week's view of higher prices into the Friday was looking good once price crossed over the 5-day filter @ 5352 kicking higher on Wednesday, but once price crossed back under 5379 on Friday then the market was heading down into the 5-day lows.

    Next week:- Monday is going to be simply defined by 5230.......

    • Daily Trading Set-ups & Analysis
  • Index Futures SPI, DOW S&P, & Forex
  • Subscribe to the Trader Premium
  • http://www.datafeeds.com.au/premiumtrader.html


  • SPI Australian Index Weekly 14th June

    SPI Weekly

    "I expect the SPI to remain flat a probably below the June 50% level, but then look for higher prices as contract expiry follows the next week" ...Previous Weekly report

    Trading below the 3-week lows and June's 50% level the expectation was to push downward this week, and now in the week of expiry the expectation is price is going to rise upwards into Friday, but then mostly likely continue lower in the next Quarter.

    If the SPI follows the June month, then it will continue down into 5100, and then probably continue lower towards 4862, but at this stage I would lean more to the SPI consolidating for a couple more weeks, with the best set-up selling down in July.

    July's 50% level and the start of the next Quarter is going to define whether the 3rd stage of the bear trend continues. The first stage was the January breakout down into March lows. the 2nd stage was the counter-trend move up into MAY, and now the 3rd stage is about the unfold in July.


    SPI Daily

    Next week's price action is going to be determined by the Weekly 50% level and the 3-day cycle.

    At this stage the view is to continue lower, but if US markets move upwards next week then the SPI will be continuing upwards into Friday (random length)

    http://usindexweekly.blogspot.com/2008/06/dow-s-weekly-report-14th-june-2008.html


    SPI 5-day pattern


    "Early next Week: trading below 5485 and look for 44 point rotations and resistance"
    Previous Weekly Report

    Last week was all about the 5-day lows @ 5485.

    Once below that the expectation was price was continuing lower in the 5-day pattern down into 5345, along with some ideal 44 point money pattern rotations throughout the day and counter-trend move upwards on Wednesday and Friday.


    • Daily Trading Set-ups & Analysis
  • Index Futures SPI, DOW S&P, & Forex
  • Subscribe to the Trader Premium
  • http://www.datafeeds.com.au/premiumtrader.html


  • Australian Index Weekly 7th June 2008

    SPI Weekly & Daily charts

    SPI drifted back down into the June 50% level and consolidated around that level for most of the Week, however with US markets selling off on Friday and a jump in Oil, the SPI will open much lower next week and head down towards the Weekly lows.

    Back in March I reported to trade up into May's highs and exit all stocks and move into cash positions, as I don't want to be trading stocks in June.

    Now it's a waiting game on when to re-enter stocks and once again look for price rotation from lower prices:- The Stock Report


    SPI Daily and 5-day pattern


    This week was once again ideal 5-day pattern trading :- rotate and extend whilst the bias was to move down and consolidate around June 50%

    Next Week:- I expect the SPI to remain flat a probably below the June 50% level, but then look for higher prices as contract expiry follows the next week.

    Early next Week: trading below 5485 and look for 44 point rotations and resistance.

    If above 5485 push back towards 5528 and stall....


    • Daily Trading Set-ups & Analysis
  • Index Futures SPI, DOW S&P, & Forex
  • Subscribe to the Trader Premium
  • http://www.datafeeds.com.au/premiumtrader.html


  •