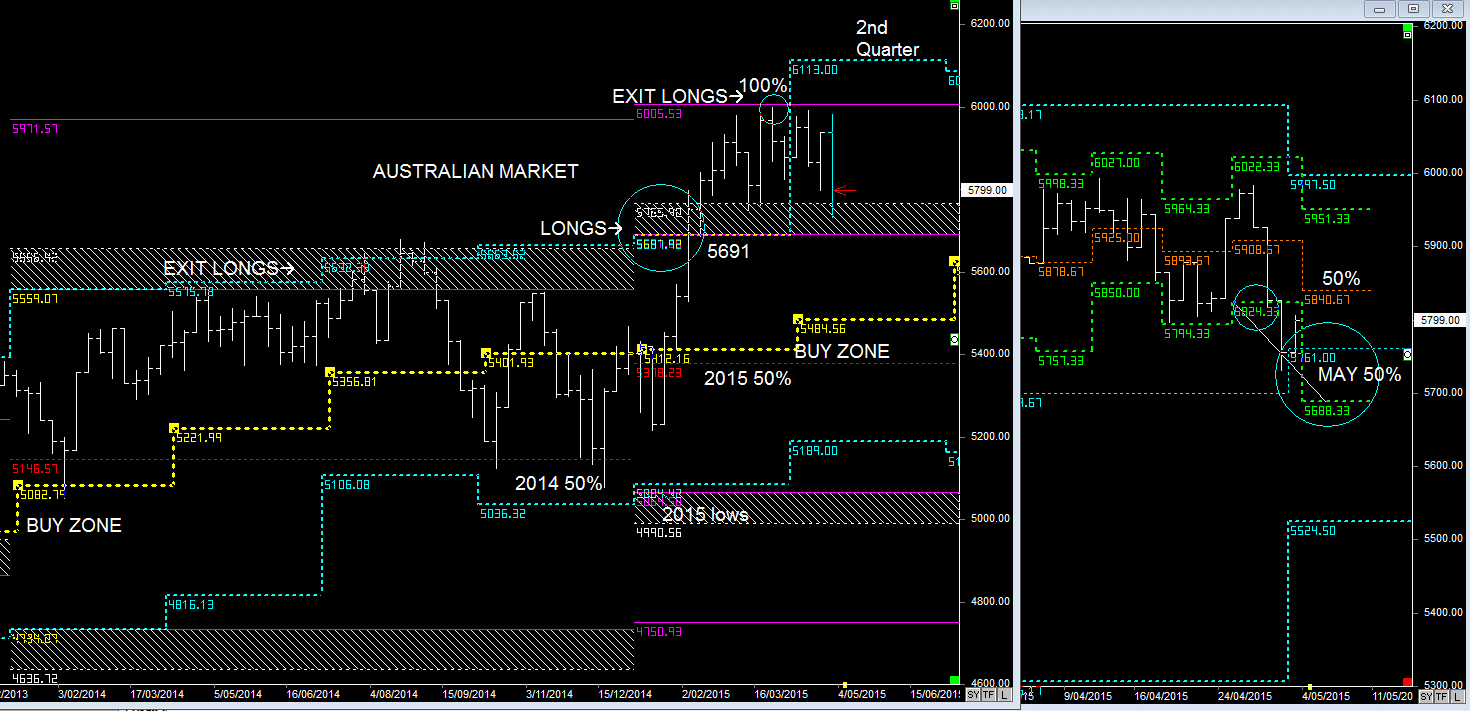
Australian Stock Market SPI Futures 25th MAY 2015
SPI Futures Primary & Monthly cycles
I've been bearish on the Aussie market ever since the SPI Futures hit 6005, and looking at the Monthly cycles the current trend suggests there is a downward 2-month wave pattern towards the June lows, and as far as the July lows. (3rd Quarter)
This aligns with the market dropping towards the BUY zone within the Primary cycles.
The interesting pattern appearing now is happening in US markets (Read the S&P 500 Report)
Even though the BUY zone @ 5484 appears in the Primary cycle, it's the trend within the Monthly cycles that help define the timing of the trade. (READ BOOK)
Posted by
Frank Dilernia
Australian Stock Market SPI Futures 4th MAY 2015
SPI Primary & Weekly Charts (click to enlarge)
The Australian Market is now consolidating between the EXIT Zone of 6005 and above the 2014/15 highs, which is forming a support zone.
However, helping to keep the Australian Market around these highs is also the Trend bias in the US markets, as they push upwards to complete targets in their own Primary Bull Trends (READ US Report)
The Australian Market is now trading around the MAY 50% level @ 5761, but there is a tiny bearish pattern in the Weekly timeframe that could see a mini break and extend pattern downward towards 5688.
Like I said some weeks ago, once the Australian Market reached 6005, I'm more than happy to exit, sit, and wait until the Market retraces into the BUY zone once again.
I'm also bearish on GOLD, (READ GOLD Report)
Posted by
Frank Dilernia
Subscribe to:
Posts (Atom)