Australia Stock Market SPI Futures 12th September 2015 Monthly Report

SPI Primary & Weekly cycles

We also have to acknowledge the SPI is now officially in a bear trend, and bear markets often follow trends lower into 2016. (2-pattern extension into the following yearly lows)

Therefore any short-term support must treat the 2015 50% as resistance for the rest of the year. (previous Report)

The Australian Market has continued its dramatic sell-off extending its low towards the 100% level of the Yearly Timeframe @ 4750

As noted in the previous report, the BEAR-Market pattern often extends towards the 2016 lows, If we use historical patterns clearly described in my book :- Market Trading Market Time, then we should see some consolidation around the current 2015 lows, but then further weakness from the 4th Quarter down into the 1st Quarter lows some time in March 2016

If that plays out, then I'd look to move back into Long positions in the Aussie Market 6 months from now using the 2016 lows and SUPPORT & ENTRY

Australian Stock Market SPI futures 24th August 2015

SPI Primary & Weekly Cycles

As noted in the Previous Report, I still wanted to see some downside in the Australian market, as it hadn't followed the 'TEXT-BOOK' support patterns.

We can now see the Market sell-off began with the breakout of the Weekly lows @ 5474, and likely to move down into this week's lows @4969, and ideal zone to be looking for a short-term swing pattern.

We are also testing the 3rd Quarter lows.

We also have to acknowledge the SPI is now officially in a bear trend, and bear markets often follow trends lower into 2016. (2-pattern extension into the following yearly lows)

Therefore any short-term support  (READ S&P 500 report) must treat the 2015 50% as resistance for the rest of the year

Australian Stock Market SPI Futures 2nd August 2015 Monthly Report

SPI Primary & Weekly Cycles

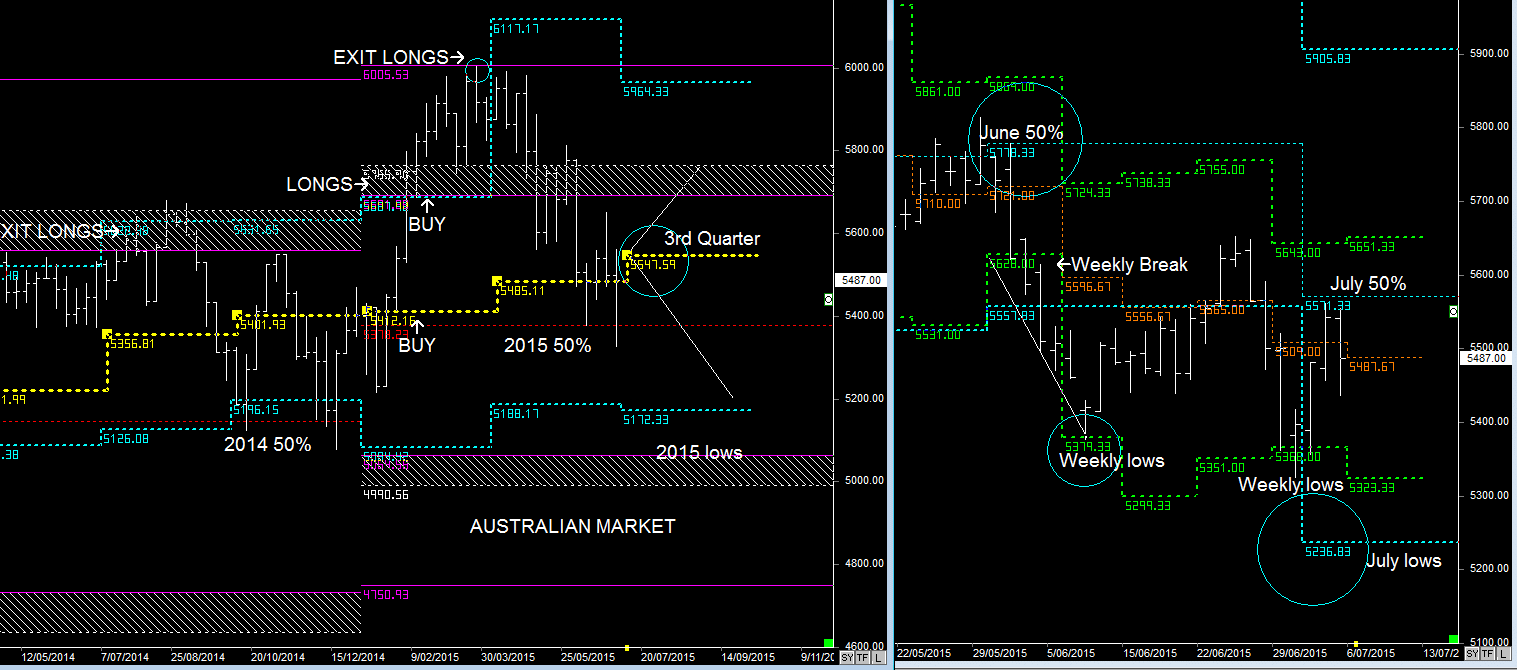
The SPI didn't follow a move down into the July lows, so it hasn't followed a 'Text-Book pattern' that often captures the next move upwards. Instead price has remained within the confines of the Weekly cycles.

TEXT BOOK Pattern:- 2 month wave pattern (July lows) or monthly support pattern.

As commodity prices drop the Aussie market is now following US markets (READ US S&P500 Report)

US markets are showing more upside, therefore the robust support levels in the Aussie market resides around 5547 in August.

I would still like to see those TEXT book patterns play out, and that might happen some weeks from now, as the market moves into a multi-week consolidation pattern (3rd Quarter Consolidation into the 4th Quarter)

Australian Stock Market SPI Futures 4th July 2015 Monthly Report


                                                  Primary & Weekly Cycles

 " There is also a pattern within the Weekly cycle that  often forewarns more weakness"           (Previous Monthly Report)

  As we can see in the above chart, the Weekly breakout pattern at the start of the previous month has seen the market follow the 'Dilernia Principle" of Break and Extend pattern downward into the following Weekly lows and now more than likely follow the trend down into the July Lows.

Normally in Primary Bull Trends the July low is a pattern to keep an eye to capture the next wave upwards, however the Secondary Cycle (Quarterly/Yellow) is showing weakness, as it's trading below 5547.

Most markets are waiting on Greece being saved or kicked out, if it's the latter then the potential move for the rest of the year is down towards 5172 and then continue lower into the 2016 lows.

A July low bounce and move back above 5547 should see another rise upwards into the end of the year, even though commodity prices are showing weakness. (READ US Report & Gold Report)

Australian Stock Market SPI Futures 8th June 2015

SPI Primary & Weekly Cycles

The Australian Stock Market is back into the BUY Zone @5484.

Do you BUY here?

If you're working on statistics within the Primary Cycles (LONG TERM), then this is the zone you want to be moving back into the MARKET.

5484 is the BUY zone in the 2nd Quarter, and if it's going to rise once again then Price should continue higher in the 3rd Quarter from July using the future level.


However, both GOLD & IRON ORE has more downside, whilst the S&P 500 is showing signs of further weakness.

There is also a pattern within the Weekly cycle in the above chart that often forewarns more weakness; Friday's close below the June lows.

Page 34 of Market Trading Market Timing...

Use Sequential ordering of pattern formations

1. Apply the trend identification Model
2. Identify Support,Resistance, & Trends
3. Identify the change of Support & Resistance with the use of TIME
4. Forewarn & Foretell the likely events in the future using Principle SET-UPS

Principle Set-up:- potentially a break & extend pattern from the June lows into the July lows

READ GOLD & S&P 500 Reports

Australian Stock Market SPI Futures 25th MAY 2015


                                                       SPI Futures Primary & Monthly cycles

I've been bearish on the Aussie market ever since the SPI Futures hit 6005, and looking at the Monthly cycles the current trend suggests there is a downward 2-month wave pattern towards the June lows, and as far as the July lows. (3rd Quarter)

This aligns with the market dropping towards the BUY zone within the Primary cycles.

The interesting pattern appearing now is happening in US markets (Read the S&P 500 Report)

Even though the BUY zone @ 5484 appears in the Primary cycle, it's the trend within the Monthly cycles that help define the timing of the trade. (READ BOOK)

Australian Stock Market SPI Futures 4th MAY 2015

SPI Primary & Weekly Charts (click to enlarge)

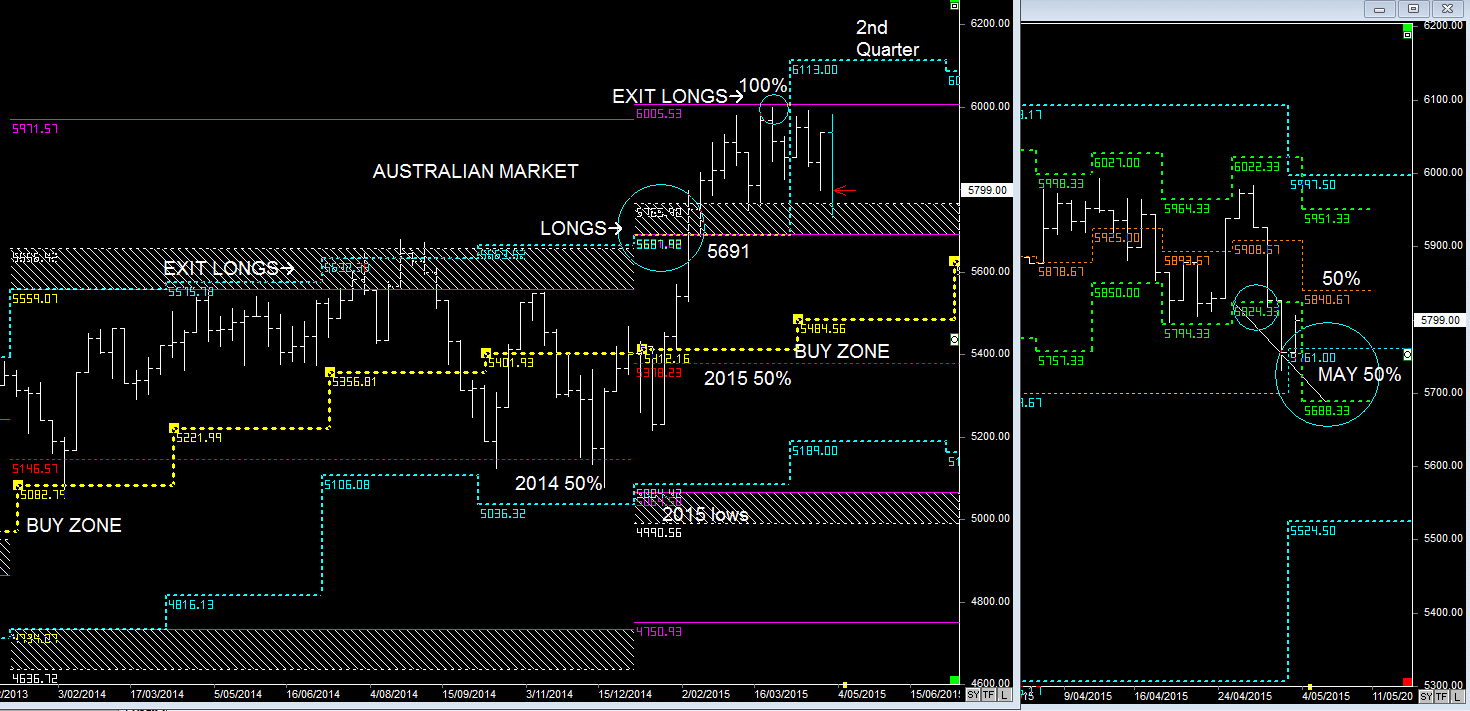
The Australian Market is now consolidating between the EXIT Zone of 6005 and above the 2014/15 highs, which is forming a support zone.

However, helping to keep the Australian Market around these highs is also the Trend bias in the US markets, as they push upwards to complete targets in their own Primary Bull Trends (READ US Report)

The Australian Market is now trading around the MAY 50% level @ 5761, but there is a tiny bearish pattern in the Weekly timeframe that could see a mini break and extend pattern downward towards 5688.

Like I said some weeks ago, once the Australian Market reached 6005, I'm more than happy to exit,  sit, and wait until the Market retraces into the BUY zone once again. 

I'm also bearish on GOLD, (READ GOLD Report)