Australian Stock Market SPI Futures 25th MAY 2015


                                                       SPI Futures Primary & Monthly cycles

I've been bearish on the Aussie market ever since the SPI Futures hit 6005, and looking at the Monthly cycles the current trend suggests there is a downward 2-month wave pattern towards the June lows, and as far as the July lows. (3rd Quarter)

This aligns with the market dropping towards the BUY zone within the Primary cycles.

The interesting pattern appearing now is happening in US markets (Read the S&P 500 Report)

Even though the BUY zone @ 5484 appears in the Primary cycle, it's the trend within the Monthly cycles that help define the timing of the trade. (READ BOOK)
Australian Stock Market SPI Futures 4th MAY 2015

SPI Primary & Weekly Charts (click to enlarge)

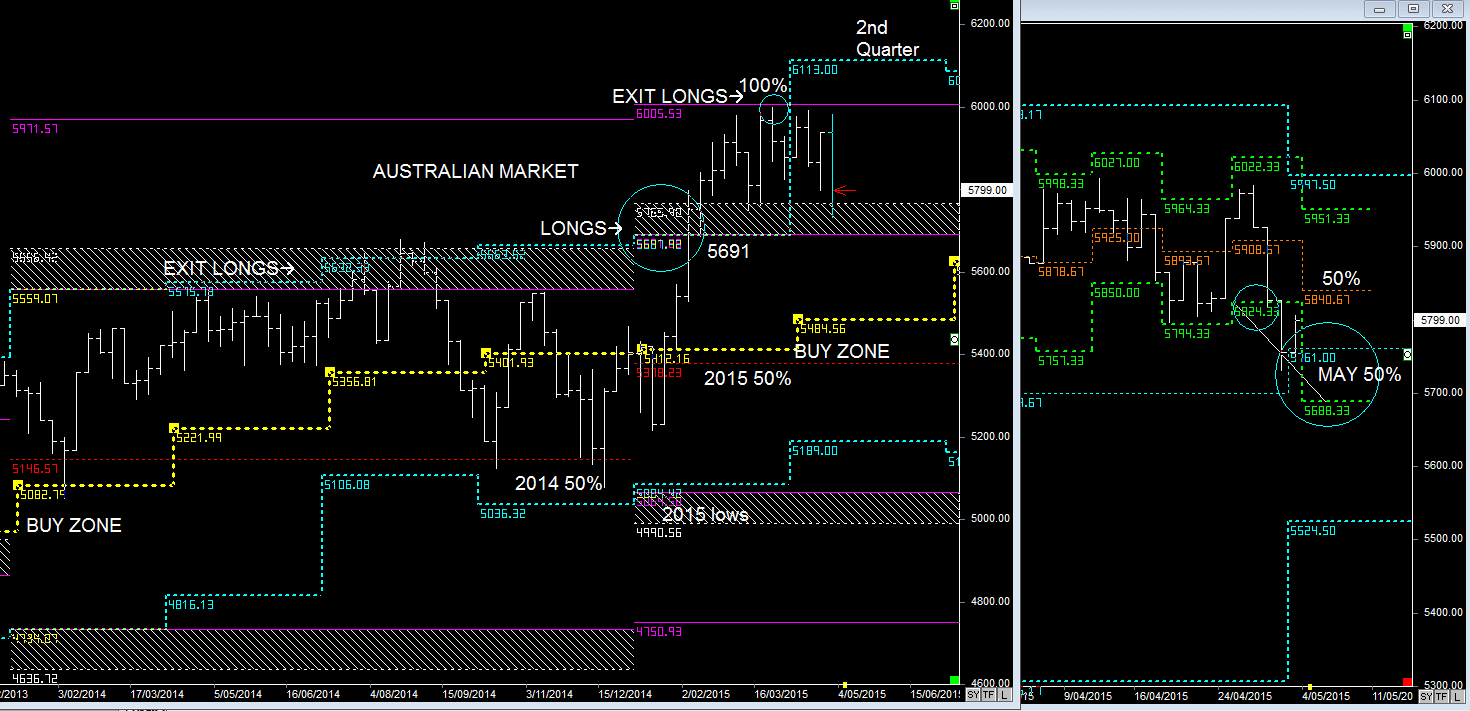
The Australian Market is now consolidating between the EXIT Zone of 6005 and above the 2014/15 highs, which is forming a support zone.

However, helping to keep the Australian Market around these highs is also the Trend bias in the US markets, as they push upwards to complete targets in their own Primary Bull Trends (READ US Report)

The Australian Market is now trading around the MAY 50% level @ 5761, but there is a tiny bearish pattern in the Weekly timeframe that could see a mini break and extend pattern downward towards 5688.

Like I said some weeks ago, once the Australian Market reached 6005, I'm more than happy to exit,  sit, and wait until the Market retraces into the BUY zone once again. 

I'm also bearish on GOLD, (READ GOLD Report)


Australian Stock Market SPI Futures 30th March 2015 Report

As mentioned in the last report:- 5691 was going to act as support and push up towards 6005... The question is... do you want to be holding LONGS once again once 6005 is reached?  I know I wouldn't, unless there's a pullback within the Quarterly cycles  (Previous Report)

SPI Primary & Weekly cycles

As noted in the previous report, it was time to get out of the market once the SPI hit 6005 (overnight 6011).

As noted in the previous report, the next term long is around the BUY zone, which is currently 5482.

The current price action is very similar to the high reached in MAY 2013 and reversal down into the BUY zone.

However, the only difference between the two patterns is that the price action in 2013 was occurring within a break & extend pattern in the Quarterly cycles, whereas this current high is still part of the current Quarterly breakout @ 5691.

Therefore there is still the potential that the market has another go at a higher high in the 2nd Quarter as part of the extend pattern, and that will depend on the price action in US markets (S&P 500 Report)

But for me, I'd rather sit on the sidelines and wait for the pullback.

Australian Stock Market SPI Futures 3rd March 2015

The Trust pattern upwards from the 2015 50% level and now a close above 5691 is extremely bullish to continue higher 
 Therefore 5691 is seen as support, as the trend can continue to move higher until the 2nd Quarter (April) 6005 is the current target.     Previous Report

SPI Primary & Weekly cycles

As mentioned in the last report:- 5691 was going to act as support and push up towards 6005...

The question is...  do you want to be holding LONGS once again once 6005 is reached? (potentially the MARCH highs)

I know I wouldn't, unless there's a pullback within the Quarterly cycles :- Monthly 50% levels

SPI Futures Australian Stock Market 9th February 2015

SPI Primary & Weekly cycles

As mentioned in the previous report, the Australian Market is back into a Bull trend. & has now completed the move into the 2015 highs.

Unlike my view last year to dump stocks around the 2014 highs, this time it's different

The Trust pattern upwards from the 2015 50% level and now a close above 5691 is extremely bullish to continue higher

Therefore 5691 is seen as support, as the trend can continue to move higher until the 2nd Quarter (April)

6005 is the current target.

AUSTRALIAN Stock Market SPI Futures 28 January 2015

SPI Primary Cycles 2015

If you've been following my reports for a while now, you'd know that I've been bearish on the Australian Market since reaching the 2014 highs. 

Normally with the alignment of the 2015 50% level, this would put pressure on the Primary cycles to move lower, as was the case with the first few weeks in January.

However, if you've read my US reports (S&P 500), you know I've been bullish, and the price action in the US has helped the Australian Market remain stable, and based on this week's price again once again move into a BULL trend. (Above 2015 50%)

However, the important pattern in the Australian market is the price action of the Precious Metals (GOLD & Silver). I was Bullish on Silver but not so much on Gold.
Both those markets now have the potential to rise upwards after being depressed for the past 2 years, which gives reason to underpin the Australian Market. (READ GOLD Report).

If GOLD & Silver is going to Rise, then keep an eye on the AUD/USD (Read Forex Report)


Australian Stock Market SPI futures 1st January 2015

SPI Primary & Weekly cycles

The 2014 50% level has supported the Australian Stock Market, and as mentioned in the previous report, the US markets continue to look bullish, which was enough to drag the Aussie market upwards and close out the 2014 Primary cycle right at a critical level.

As mentioned in previous reports, the 2015 50% level @ 5377 is going to define the trend for the next 2 years, especially if it's trading below it. 

If you look at precious metals (read Gold Report) my view is that there is weakness in those commodities which is enough to push our market down into the 2015 lows, however US markets continue to look bullish. 

As we can see the SPI is going to open above on the January 50% level @ 5355 which is going to define the short-term trend.

Read S&P report