Aussie ( SPI)Index Weekly 27th Dec 2008


Australian Index SPI Futures Monthly

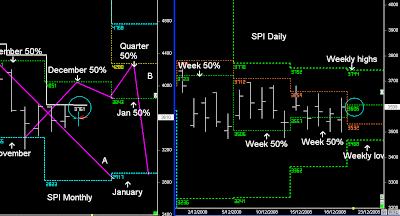
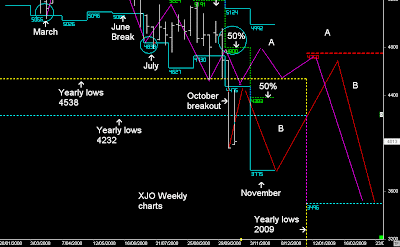
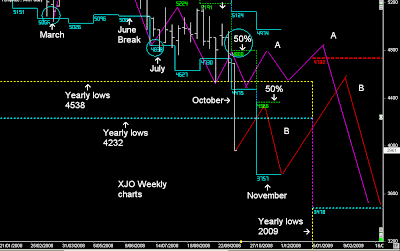
The Australian market is still in SET-UP A:- drifting lower below the Monthly 50% levels and following the dynamic timeframes lower, eventually pushing the market into lower lows in 2009.

Next week is the last week of trading for 2008, so it's important where markets close on the last day, as they will set-up the Primary cycles for 2009 and how far markets will go lower in the new year.

In the mean time next week's trading will still be defined by the 3-week highs, and SET UP B won't occur until there is a Friday close above those highs. (White line)


SET UP B
is the probability of markets moving back towards a 3-point level of 'TIME' before the market continues lower.

In this instance, Price in January would be rotating back towards the Yearly breakouts from 2008, the first Quarterly 50% level in 2009, and also the 3-month highs in January.

We also notice in the forward timeframe that there is now a higher low in the forward monthly timeframe, which often favours higher prices.

I still think all global markets will follow SET-UP B first before continuing lower in 2009, but if it doesn't markets will still go lower in 2009.


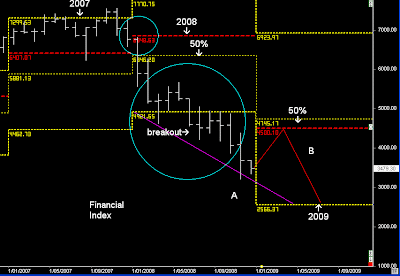
Financial Index

And the direction of the Financials will have a big bearing of the direction of the overall market.

The breakout of the 2008 lows in the Fin Index and the Financials were always going to struggle to move higher in the 2nd half of 2008, but I always thought the banks were moving into lower lows in the following year, as price follows the Dilernia Principle of 2 prices waves of time

And the financial Index will move down into the lower low in 2009.

So if you are thinking of moving into banks on the long side around those lows would be it.

At this stage the Financial Index is in SET-UP A and heading down into those 2009 lows, but there is still the possibility that SET_UP B plays out, and swings back into the higher timeframe 50% levels before price continues down into the lower lows for 2009.

Aussie ( SPI)Index Weekly 20th Dec 2008


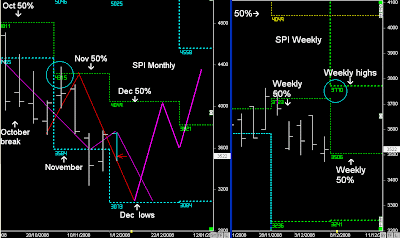
SPI Monthly

SPI consolidating since finding support around November's lows.

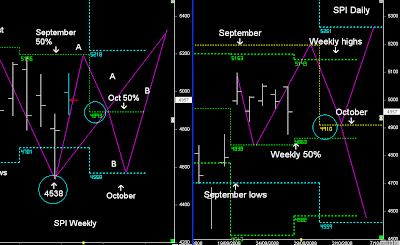
I still have an expectation that the Market will continue lower in 2009, but I would like to see the SPI rotate upwards into the Quarterly 50% level before it continues down in the new year.

But that won't occur until there is a Friday close and breakout of the 3-week highs @ 3761.

This is simply based on price rotating back into the higher timeframe midpoints before the next trend continues lower in the new year.

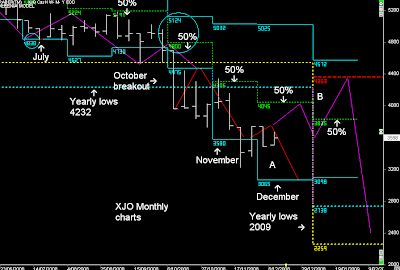
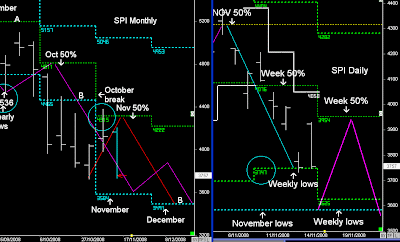
For every breakout price will normally come back and test the breakout in the next Timeframe and then continue with the trend. A perfect example was October breakout and then the rotation back into the November 50% level, and then Drive down into lower lows in November.


SPI Monthly and Weekly

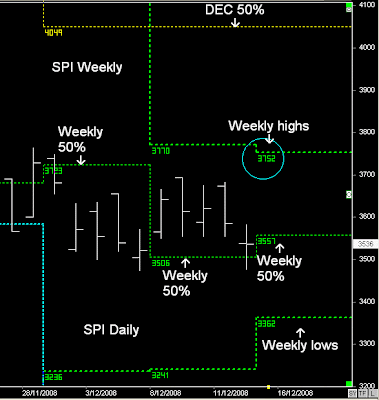
The down trend in the 4th Quarter ceased once price found support at the November lows but was verified with the shift in the Weekly 50% level @ 3506, and the market has now moved in a tight 3-week sideways pattern, which eventually price will breakout of.

As mentioned before, any up-trend won’t occur until there is a breakout of the 3-week highs.

Next Week gets interesting on the SPI as there is a divergence of the Weekly timeframes and a shift in the Filter from above to below @ 3532 (brown).

The downtrend can continue lower next week if trading below 3532 which is part of the bigger picture of continuing lower in 2009, and confirmed with a breakout of the 3-week lows.

But it also can be the spring board for the rotation upwards, which is what I think will happen, completing the retest of the Yearly breakout @ 4232 and the rotation back into the higher timeframe Quarterly 50% level.

As a SPI Futures day-trader I'll be trading on the side of 3606 as my bias either way next week.


  • Daily Trading Set-ups & Analysis
  • Index Futures SPI, DOW S&P, & Forex
  • Subscribe to the Trader Premium
  • http://www.datafeeds.com.au/premiumtrader.html


  • Aussie ( SPI)Index Weekly 13th Dec 2008

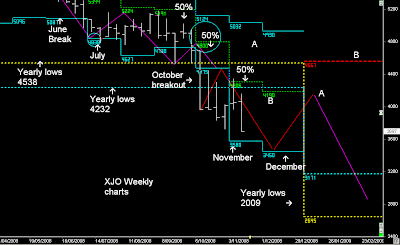
    Australian Market Yearly

    The Australian Market is going lower in 2009!!!

    However it depends how it's getting there that's the important thing when trading.

    Currently the Market is in Set-up A:- drifting lower below the Monthly 50% levels and following the dynamic timeframes lower.

    Eventually price will reach the 2009 Yearly lows, but it still won't be the lows for 2009. But i'll get back to that in a few weeks time in the new Year.

    Set-UP B:- Is what I think will happen or hope to happen.

    SET-UP B is based on a timeframe breakout.

    A Timeframe breakout normally comes back and retests the breakout at the start of the new timeframe, in this instance the Yearly breakout @ 4232 in 2008, and the start of the new Yearly timeframe in 2009.

    Therefore my expectation is that early in the first Quarter price will try to make it's way back towards 4232, and then continue lower.


    SPI Futures Monthly

    "Those 3-week highs in all global Index markets are extremely valid resistance zones, and have been all year.

    But eventually they will break, and markets will begin a rotation upwards as part of the larger timeframe cycles"
    Previous Weekly report

    We can see the test of the 3-week highs early on Monday and the push down.

    Set-up B won't occur until there is a breakout and a Friday close above those highs (3763)

    Once that occurs I'll be looking for a move towards December's 50% level (resistance), stall and another consolidation period for about 2 weeks, and then a higher move back towards the Quarterly 50% level in the first Quarter of 2009.

    That price action meets the Yearly timeframe breakout.

    Once that occurs I would be looking for the next leg of the down trend into the 2009 lows.


    SPI FUTURES WEEKLY

    As we can see there was a shift in the Weekly 50% level from top to bottom, and whilst price is trading above the Weekly 50% levels, I still have the view that markets should be heading higher, but we need to verify this with a breakout of those 3-week highs.

    For Day traders they can see the same re-occurring patterns over the past 3 weeks, Higher daily opens result in lower Daily closes, and lower Daily opens result in higher daily closes.

    Eventually there will be a breakout of the 3-week range and will result in the next trending period, which in fact is simply the rotation back towards higher timeframe 50% levels, and the next 'Thurst' pattern based on the Dilernia principles of following the Primary cycles of the market into new lows in 2009.

    Aussie ( SPI)Index Weekly 6th Dec 2008

    SPI Monthly and Weekly charts

    The trend is down and the expectation is that the Trend will continue lower in 2009.

    Currently I have the view that global markets are moving lower into December's lows and complete the double monthly low pattern before a potential reversal upwards.

    However, I've always maintained that for any trend to continue lower in 2009 price needs to swing back upwards and move back towards the 3rd Quarter breakouts (September).

    This will result in the retesting of the 2008 Yearly timeframe lows verifying the breakout, and then continue lower in 2009.

    Once that UP move occurs, my view is that breakout level will form a resistance zone and markets will be moving lower in 2009.

    But things get extremely interesting next week in all Global Indexes and currencies...

    The important part on any trend continuating lower, or even any major trend reversal begins with the break of the 3-week channels, in this instance the 3-week highs

    Any long term trend won't change unless there is a breakout above the 3-week highs, and then continues above the Monthly 50% level.

    This normally occurs with a Friday close above the Weekly highs, and the following week continues higher.

    Any continuation of the long term trend (down) normally occurs with price retesting the 3-week highs and then rejecting downward, as it continues with the trend towards the Monthly lows.


    SPI Weekly and 5-day pattern

    Last week's view was a higher Weekly open and a 2 day down move. That played out and then the next 3 day's consolidated within the 5-day range and the SPI Primary Range of 87 points.


    Next Week:- I have the expectation that Global markets are moving towards the Weekly highs next week. http://usindexweekly.blogspot.com/

    Around those Weekly highs and the view is resistance ( until broken with a Friday close above), with the expectation of a move down into December's lows to complete the 2-monthly timeframe pattern.


    A breakout and Friday close above those Weekly highs, and my view is that markets are moving back towards higher Monthly close in December, as it goes looking to move back to re-test the Yearly breakout in early in 2009.

    Therefore for any reversal upwards needs to see a Friday close above 3770.


    The trend remains down and the expectation is that market's will continue down, but any reversal upwards in the medium term will begin with a breakout above those 3-week highs confirmed with a Friday close above them.

    Those 3-week highs in all global Index markets are extremely valid resistance zones, and have been all year.

    But eventually they will break, and markets will begin a rotation upwards as part of the larger timeframe cycles.

    Aussie ( SPI)Index Weekly 29th Nov 2008

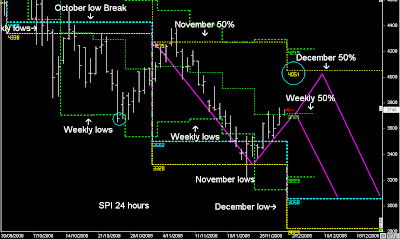
    SPI 24 hour market

    So far the 4th Quarter breakout pattern in the first week of October is playing out precisely.

    October lows resistance, reverse back into the November 50% level and thrust downward into the November lows....

    And now a rotation upwards towards the December 50% level, with the potential of further weakness next month.

    SPI MONTHLY & WEEKLY


    November lows support and a late rally on Friday has pushed the SPI upwards, as it looks to move towards the December 50% level next week.

    Once Tuesday opened above the November lows @ 3584, helped by US markets reversing off their November lows, my view of November support and rotation back towards the December 50% level is playing out.

    I also have the view that there is a double monthly low pattern to play out, with lower prices down into December's lows.

    The move down into December's lows will depend on Financial stocks, Resource stocks, and also US markets....

    http://usindexweekly.blogspot.com/2008/11/dow-s-weekly-29th-november-2008.html


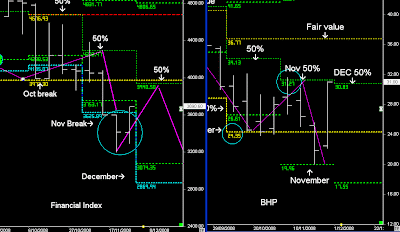
    FINANCIAL INDEX & BHP (resource stocks)


    Financial Index:-Banking stocks have struggled to bounce upwards in November because of the breakout of the November lows:- Financial Index resistance

    These resistance levels shifts in December, so any bounce in this Quarter has the potential to move towards the December 50% levels, as resistance disappears.

    It is the same pattern as the October breakout and November 50% level 'thrust' pattern downward.

    Because of the breakout of the 4th Quarter, there is also the pattern of following the the market lower into December's lows in the Financial Index.

    Resource stocks BHP:-

    BHP drops the bid on RIO and BHP Shares rally back towards the Monthly 50% levels....

    BHP thrust pattern down from November's 50% level into November's lows reversing upwards

    At this stage I would treat BHP as range bound between the December 50% levels and the Monthly lows.

    There could be a move higher towards fair value in December, but being a higher weekly open and in a bear market, I would view BHP as range bound between those levels.

    Therefore there can be higher prices early next week, but at this stage I can't see the Aussie market higher than the December 50% level, but I do see lower lows in December when looking at Financials and Resource stocks.

    The Reserve meets on Tuesday and the expectation of a cut on % rates.

    How much is cut will obviously influence the direction of the market in the short-term.

    Aussie ( SPI)Index Weekly 22nd Nov 2008


    Australian Index: XJO

    November 50% level push down into November’s lows, with the expectation of a 2nd wave down into December’s lows.

    However, November’s lows haven’t held, which coincided with Resource stocks breaking their 4th Quarter lows on Wednesday, along with US markets moving down into their November lows the following day.

    http://usindexweekly.blogspot.com/

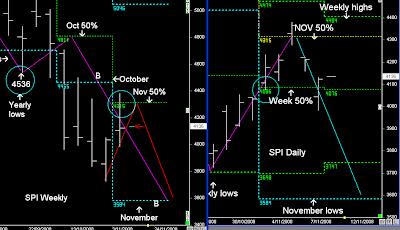
    Therefore I would look for a similar pattern as the October breakout, where price will probably swing back to retest the November low breakout @ 3584 sometime next week, and then more than likely continue down into the double low pattern in December.


    SPI Monthly and Weekly

    Last Week I was looking for a down move on Monday and Tuesday to complete the November low pattern, and then from Wednesday to begin a swing back towards the Weekly 50% level, before the market continued down.

    Except on Wednesday Resource stocks broke lower on the day they lift the 'short-ban' driving the market lower, and US markets were still much higher as they were moving down into their November lows:- Dilernia Model

    However, I expected Resource stocks along with Financial stocks to continue lower this month, and slightly lower in December also.


    Next Week:- October low breakout 3548, and expectation price will remain below this level for next week.

    Personally I would like to see Monday and Tuesday next week continue the drive down into lower prices towards next Week's lows, and then see how Wednesday opens.

    If Wednesday opens above Tuesday’s lows, we will probably see a short-term 3-day move back towards 3584.

    If you notice the breakouts in multiple timeframes, price comes back and retests the breakout and then continues with the trend, which is what has been happening throughout this year.

    A close below 3584 in November, will probably see lower prices in December.


    What's going to push the market higher is Financials, and banking stocks aren't ready for any moves higher other than short-term 3 to 5 day up moves.

    December's lows complete the double Monthly low pattern, which can provide a relief rally similar to when the double Monthly lows pattern occurred in March 2008.

    And in late December or early January begin a major swing back towards the Yearly breakouts @ 4232

    And the same pattern of a retest of the yearly breakout of 2008 :- 4232.

    Which hopefully occurs in the first Quarter in 2009.


    Therefore it can bottom out in December’s-January’s lows, and then swing back to reset of the yearly breakout. Which will take about 2-3 months to complete the move back.

    After that move, I wouldn’t touch stocks because price will mostly come back towards to the previous lows over the following 3-6 months and continue lower in 2009.

    As a new Primary timeframe begins, and probably move into lower lows in 2009.


    • Daily Trading Set-ups & Analysis
  • Index Futures SPI, DOW S&P, & Forex
  • Subscribe to the Trader Premium
  • http://www.datafeeds.com.au/premiumtrader.html


  • Aussie ( SPI)Index Weekly 15th Nov 2008

    XJO Australian Index

    Expectation that Global Index markets would swing back into the November 50% level and then continue down into November's lows.

    At this stage the expectation is that November's lows will form a robust support zone, but continue lower into December's lows.....

    Dilernia Principle:- 2 timeframe wave pattern on the breakout.

    Once December's lows are reached, then there is an expectation that market will swing back up to retest the Yearly low breakout @ 4232 , and then continue down in 2009.


    SPI Monthly and Weekly

    November's lows should be reached next week, which will coincide with the G20 meeting giving markets enough reason to reverse off their lows and swing back into the Weekly 50% level.

    But because of the monthly 2 timeframe wave pattern, I've modelled a lower low in December before the market reverses back towards 4200+.

    There is still an expectation that 2009 will go lower, but the pattern to confirm the market going lower is a re-test of the break early in 2009 then continue down into lower lows.

    SPI Monthly and Weekly 24 hours.

    In the 24 hour market :- the Dilernia Model has different levels because of the greater ranges.

    We often see price move in the day session within their own timeframe levels, but will extend to greater ranges based on the 24 hour model.

    In the day session the SPI continued down into the Weekly lows @ 3747.

    But in the 24 hour market, price continued down into it's own Weekly lows @ 3674.

    What do you notice when the market broke out of Octobers lows?

    The market moved in a 2 timeframe wave pattern down into the Weekly lows @ 3706 and then reversed back towards the November 50% level.

    Next Week the double Weekly lows @ 3559 match closely to November's lows, and the expectation of a swing back towards the Weekly 50% level.


    I'm not expecting markets to rise much further than the Weekly 50% level, but there is a possibility of a 4th Week UP move but more weakness in early December.

    Aussie ( SPI)Index Weekly 8th Nov 08

    SPI Monthly and Weekly

    Expectation that the Aussie market would swing back into the November 50% levels early this week, and then reject back down towards the November lows.

    At this stage the first pattern has played out, but if there is going to be a continuation down into the November lows, it will be lead by Financials (as per previous report), and my expectation of resource stocks moving down into their November lows.

    But it will also be helped by US markets...... http://usindexweekly.blogspot.com/

    If US markets don't sell off on Monday, then there is a view that next week could actually move back towards the Weekly highs.:- "consolidating Weekly pattern"

    SPI 5-day pattern

    Last week's trending period was mapped out using the 5-day pattern into Wednesday's highs.

    I was looking for a reversal back down into the 5-day 50% level once price moved back inside the upper blue channel, but sadly price gaped lower because of US markets reversal.


    Next Week:- If the Aussie market is going to continue higher, then it should be push upwards from the Weekly 50% level and be trading above 4173, moving into a consolidating 5-day pattern between the Weekly 50% level and Monthly 50% level.

    Below 4118, and my view will be the SPI heading down towards the 5-day lows:- 2nd week sell-off after the Monthly 50% level rejection.

    As I mentioned in last Week's report: my buy positions on stocks are much lower in November and i'll wait until things move down into the BUY levels.

    For short-term futures and Forex:- it's all about the 5-day patterns, filters, and Spiral points.


    • Daily Trading Set-ups & Analysis
  • Index Futures SPI, DOW S&P, & Forex
  • Subscribe to the Trader Premium
  • http://www.datafeeds.com.au/premiumtrader.html


  • Aussie ( SPI)Index Weekly 1st Nov 08

    I Read some forums and you can easily find the perma bulls and perma bears.

    Perma bears are making hay while the sun shines. They are the one's sitting in cash, waiting and taking pot-shots at bulls who keep buying falling markets.

    Whilst the bulls keep trying to call bottoms in the market, and have done so since the first lows in March. Any sign of a bullish candle, oversold oscillators, 3 up days in a row, and they believe the bottom of the market has been confirmed and a new bull trend will begin.

    There will always be a bottom in the market each month and each quarter, but it’s how you use those bottoms that matters most, not what you think will happen after a 3-5 day rally.

    As I've always said... "those that anticipate best will prosper".... and I'd like to be Buying as close to support as possible, not after a 3-5 day rally.

    Simply trade what you see and not what you think will happen. Adjust to market dynamics and be patient, the trades will always appear.

    Around these October lows I’ve traded Resource stocks twice, and exited both times with the best gains of 17%:- BUY support.

    This support disappears in November. What this means is, my BUY zones in October have shifted lower but doesn’t mean the market will go lower.

    I’m in cash positions on both the Financials and Resources stocks. If the market goes down in November I’ll trade accordingly using my model.

    If in fact the lows in October have been set and the market continues upward next week, then I’ll adjust to the market.

    All I'm concerned is trying to trade and make over 15% per quarter, the more downside, the more frequency of trading each quarter and the more potential return.

    15% per quarter can easily end up being 50% per quarter:- 3rd quarter lows on Financials were a perfect example.

    At this stage in this down trend I still think it’s way too early to be buying and holding stocks for the long term......


    XJO Yearly

    11th October Weekly Report:- "A Monthly and Quarterly close below the Yearly lows constitutes a breakout, which will lead to further erosion in stocks prices in the 4th Quarter...and a bear market and then another leg down into 2009

    October lows resistance (breakout forms resistance), and the trend guide for the 4th Quarter will be defined by the November 50% level.

    If that's the case:- then around November lows could provide the ideal 'swing' low for a swing back towards the 2008 lows breakout"


    Since that Report the Market has reversed back up into the October low breakout and reversed back down.

    This often occurs to verify the breakout, which more often than not leads to further weakness into the extended lows in the following month:- 3580

    At this stage:- whilst price is below the November 50% level the expectation is that price is going to continue down into November lows.
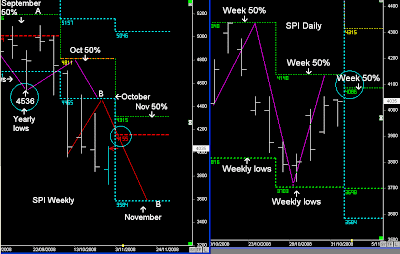

    SPI Futures:- Monthly and Weekly


    Is the Aussie market going to continue up towards 4315 in early November, or reverse down from next week and continue down into November lows?


    I can't answer that until things begin to unfold... but a higher Weekly open and trading below the Monthly balance point @ 4155, can easily sell down at the start of next week.


    If the Aussie market was going to continue higher in November, it should have already be trading above the Weekly 50% level....In fact it struggled to even get that high last week:- 4140
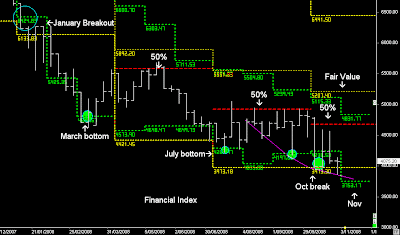

    Financial Index:-

    And when I analyse resource stocks and the Financial Index the same breakout patterns have occurred even though these stocks look supported in October.

    This is the first time since the January breakout that the Financial Index has closed below it's Monthly lows, which more often that not goes lower in the new month.

    The Financial Index should have bounced off the 4th Quarter lows in the first 2 weeks of October and should have closed above the October lows, and not below.

    Resource stocks have been supported above 4th Quarter lows, which I've bought and sold on 2 occasions in October:- Exit Weekly 50% levels.

    But both BHP and RIO have failed to close above their October lows:- Dilernia model.

    This favours more downside in November.

    Note: there is no guarantee that the market will go down into 3580 in November, but after buying stocks on two occasions in October and selling them, I'm happy to sit in cash positions and wait until things begin to unfold.

    Note: As my 11th October report suggested, if price can move down into November lows, this will be the pattern that I think should finally get more Buyers appear pushing the market higher into the close of the 4th Quarter....
    But will eventually lead to lower prices in 2009.

    Aussie ( SPI)Index Weekly 25th Oct 08

    Australian Index Yearly charts

    As I've been saying for the past 10 months:- lower prices into 2009......

    The only problem for most investors is:- the lower markets go in 2008 the lower 2009 will go, as it keeps pushing the market lower in the forward Yearly timeframe.

    SPI Monthly and Weekly charts

    "SPI trading below October lows and expectation price will remain below these lows for the rest of this month.

    Lower Weekly open therefore there is an expectation that price will rotate back towards the Weekly 50% level.

    That could occur in the first 2-3 days, and then the possibility of continuing down towards the Weekly lows"
    ............20th October Premium Report


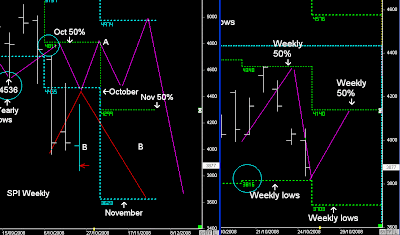
    This Week the SPI traded outside the Monthly break and followed the timeframe with a 'test and Reject pattern' down into the Weekly lows.

    Next Week:- much the same as this week, with the closing price next Friday defining the trend path for November and potential down move into November lows.


    SPI 5-day pattern

    Monday started with a move above 4063 and began the 2-day move back towards the Weekly 50% level @ 4340.

    Once Wednesday broke the 5-day 50% level, the rest of the week followed the 5-day pattern lower.


    • Daily Trading Set-ups & Analysis
  • Index Futures SPI, DOW S&P, & Forex
  • Subscribe to the Trader Premium
  • http://www.datafeeds.com.au/premiumtrader.html


  • Aussie ( SPI)Index Weekly 18th Oct 08

    XJO Cash Monthly chart


    "My view on Resource stocks were that they were moving down into lower lows in November. With Resource stocks moving lower in the 4th Quarter and Financials already trading around near their highs in the 3rd Quarter, there wasn't much hope for the Aussie Index.

    I've been bearish on Resource stocks in the 4th Quarter with the expectation of lower lows into November" Previous Weekly Report

    This Week Resource stocks have been hammered. There could be some support coming into resource stocks around this week's lows, which could support the market for a couple of weeks.

    But as I've been saying for a number of weeks now since August:- I expect further weakness of resource stocks into November:- Dilernia Principle


    "Long term:- October lows resistance (breakout forms resistance), and the trend guide for the 4th Quarter will be defined by the November 50% level.

    If price remains below the October lows and closes below the October lows on the last day of this month, then there is an expectation that price will continue down into November lows.

    If that's the case:- then around November lows could provide the ideal 'swing' low for a swing back towards the 2008 lows breakout.

    If there is any support around the November lows, then this can result in Price making it's way back towards the breakout of the 2008 lows late in this 4th Quarter or early in the first Quarter in 2009, and then continue lower from 2009 into the new Yearly lows. "

    Previous Weekly Report

    This Week has seen the Aussie Index like all global indexes test the October low breakout and fail.

    I'm currently looking for a couple more weeks of sideways volatility, and then define the Trend by November's levels, as shown above.

    Any down trend into November's lows, and my view is will be price will finally find 'a bottom' in 2008, but not 'the bottom' in this bear market.

    I'm still expecting lower lows in 2009.

    Aussie ( SPI)Index Weekly 11th Oct 08

    "Worse case scenario:- October 50% level rejects prices and fails to close above the 50% level for the rest of the month and then continues lower for the rest of 2008.

    This results in the Yearly timeframe closing below 4232, pushed down by resource stocks. I've been bearish on Resource stocks for the 4th Quarter, and I do have a view that resource stocks will be making lower lows into November.

    A Yearly close below 4232 constitutes a breakout in the Yearly timeframe, which eventually leads to another 2 year ‘bear market’ into lower lows in 2010.

    It also pushes the lows in 2009, which leads to further erosion in all stock prices, before any counter-trend move upwards"


    Previous Weekly Report


    Australian Index (XJO)

    The Australian Market like all global markets followed the 'crash' pattern in the 4th Quarter, and like all other markets are now trading below their Yearly lows. (support)

    I expected weakness in the 4th Quarter, and I expected another down leg in 2009, but I didn't expect the carnage that occurred this week.

    Energy and Financial Indexes

    Resource stocks and Financial stocks make up the largest component of the Australian Index. Therefore if I'm interested in trading those stocks, it would make much more sense to look at those individual indexes than making decisions based on the XJO.

    Trading and analysing the Index is fine when trading Index Futures, but if trading certain stocks then it's better to have a look at their own index and see where support and resistance is to make certain decisions when trading BHP, RIO or any of the banks.

    Even before this price action occurred this week, my view on Resource stocks were that they were moving down into lower lows in November. With Resource stocks moving lower in the 4th Quarter and Financials already trading around near their highs in the 3rd Quarter, there wasn't much hope for the Aussie Index.

    I've been bearish on Resource stocks in the 4th Quarter with the expectation of lower lows into November. I've also expected the Financials stocks to come down into their own 4th Quarter support zones @ 3973 on the Financial Index.

    The 'crash' pattern last week wasn't all because of Financials, Resource stocks dragged down by falling commodity prices were also part of the drop.

    Both the Resource stocks and Financial stocks are now trading around 4th Quarter support zones. It's these support zones next week that will give all traders are better idea how the overall market is fairing.

    If support is valid next week in both, and the overall market moves up from the lows, I have a feeling that Financials are going to fair better than resource stocks, because I still view resource stocks moving down towards the Yearly lows (8398)


    SPI Weekly and Daily charts

    There are still over 2 months to go before this year ends, but where price closes in 2008 will determine how far markets go down into 2009.

    As previously pointed out:- the lower it closes in 2008 the further it goes down into 2009.

    The only redeeming factor in this current price action is:- price will go back and re-test the 2008 breakout some time before the market continues down the following year.

    I normally have a fair idea on price action and the direction of the market using dynamic support and resistance zones within each higher timeframe:- Monthly, Quarterly & Yearly.

    Last Friday (October 3) the Aussie market closed above the support levels, however US markets closed below their Yearly and Quarterly lows on the last day, resulting in a 'crash' pattern last week dragging all global markets down much further than expected.

    http://www.usindexweekly.blogspot.com/


    So what do I Think will happen?


    Long term:-
    October lows resistance (breakout forms resistance), and the trend guide for the 4th Quarter will be defined by the November 50% level.

    If price remains below the October lows and closes below the October lows on the last day of this month, then there is an expectation that price will continue down into November lows.

    If that's the case:- then around November lows could provide the ideal 'swing' low for a swing back towards the 2008 lows breakout.

    If there is any support around the November lows, then this can result in Price making it's way back towards the breakout of the 2008 lows late in this 4th Quarter or early in the first Quarter in 2009, and then continue lower from 2009 into the new Yearly lows.


    In the Short-term:- Hedge funds will continue to play around with the same 5-day pattern each day, and the Weekly ranges (green) shown in the Daily chart should be the trend guide for next Week.

    I'm not going to pick the bottom in this market, the first sign will be a move above the 5-day 50% level, but will need to be confirmed with price trading above the Weekly 50% level.

    But the overall Index will de defined by how well both the Energy stocks and Financial stocks re-act to their Quarterly lows next week.

    Aussie ( SPI)Index Weekly 4th Oct 08

    Australian Cash market (XJO)


    Yearly lows reached @ 4538 in September, but any up trend in the 4th Quarter is defined by the October 50% level.

    Best case scenario for the rest of 2008 is:-

    October 50% level is the trend guide for the rest of this month.

    A SET-UP:- October 50% level rejects price down into October lows forming a double bottom and then reversing upwards, crossing over the Monthly 50% level sometime during the month, and then continuing higher into the close of the year

    This would lead to a zig-zag formation for the next 3-months, but will eventually lead to lower lows in 2009.

    Worse case scenario:- October 50% level rejects prices and fails to close above the 50% level for the rest of the month and then continues lower for the rest of 2008.

    This results in the Yearly timeframe closing below 4232, pushed down by resource stocks.

    I've been bearish on Resource stocks for the 4th Quarter, and I do have a view that resource stocks will be making lower lows into November.

    A Yearly close below 4232 constitutes a breakout in the Yearly timeframe, which eventually leads to another 2 year ‘bear market’ into lower lows in 2010.

    It also pushes the lows in 2009 lower than if Set UP A occurs, which leads to further erosion in all stock prices, before any counter-trend move upwards.

    Even though both scenarios will lead to lower lows in 2009, I hope that we don’t follow the worse case scenario and close below 4232.

    But I’ll come to that at the end of 2008.

    Until then it’s all about the October 50% levels in all global markets and how far Resource stocks drop into November.

    Aussie ( SPI)Index Weekly 27th Sept 08

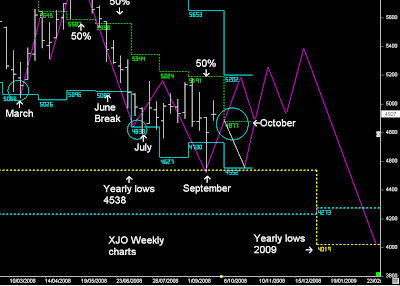
    XJO Cash

    Yearly lows reached @ 4538 and expectation that the next Quarter will rise upwards in monthly step formation to close the year higher, and then the expectation is that price will continue lower in 2009.
    My job is to find the highest probability entry for myself and my readers to take 15% on stock positions the last quarter.
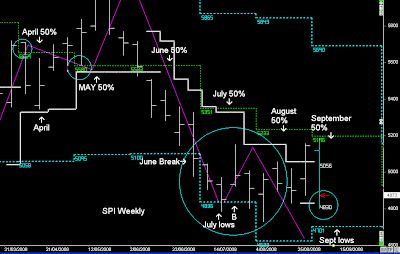
    Add that to the reversal off March lows in the first Quarter, April's higher lows in the 2nd Quarter and then the move upward into MAY's highs. The double low pattern in July and September in the 3rd Quarter, and you soon begin to see that over the course of the year trading LONGS in a bear market can be very profitable.

    SPI Weekly and Daily

    As mentioned before, the Yearly lows and reversal upwards is dependant on October 50% level in the next few days.

    I also mentioned that the up move next Quarter is dependant on resource stocks, it still wouldn't surprise me to see the October 50% level push the market back down in double lows.

    Even if there is a double low in October my view still remains a higher close in the last Quarter.


    "In ‘bull’ market stocks normally compound 12% per year, however the potential to make money could even be greater in a bear market than in a bull market, even though the trader is buying stocks in a down trend.

    How is this possible?

    In a Bull market stocks rise upwards, but don’t necessarily reverse back down into double monthly lows more than once a year. If banking stocks remain in a consolidating trading pattern in the current year, price will come back down far more often, which increases the frequency of trading. Whilst the exit strategies are based on exiting around the higher timeframe 50% levels, or even using the Weekly channel highs.


    Depending on the entry level this will give the trader the potential to take between 10-15% on stocks in each 3-month period. The expectation is that, in every Quarter price could move back down into the lows. If the trader can use this strategy every Quarter, then there is a potential to make around 40-50% on stocks using swing trading patterns and channel lows in Bear Markets, as they consolidate for the rest of the current Year."


    BOOK:- The Trader Trading ….. principles of successful trading….


    BUT those 40-50% returns were achieved in the 3rd Quarter alone depending on which banking stock was traded, therefore the 4th Quarter might throw in a few more pleasant surprises.

    Aussie ( SPI)Index Weekly 20th Sept 08

    XJO Cash Weekly charts

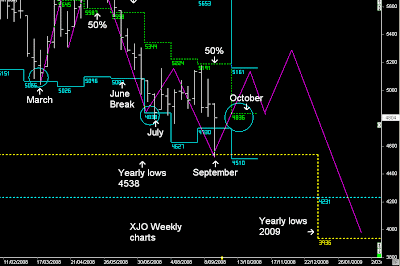
    This Week the SPI and XJO reached the 2008 Yearly lows @ 4538.

    This was my down target for 2008, and both hit the level precisely and rallied, as did US markets.

    The lows for 2008 have been set, and my expectation is that price will begin a gradual up swing in the next Quarter.

    How far the markets will move will depend on Resource stocks in the next Quarter, and then each monthly step formation, with the possibility of moving back towards 5355 over the next 3-months.

    As was the case with this year's down trend into 4538:- there is a market path for price to move towards based on higher timeframe dynamics, but price will zig-zag within lesser timeframe dynamics until it gets there, which is often based on each Monthly timeframe.


    SPI Weekly:-

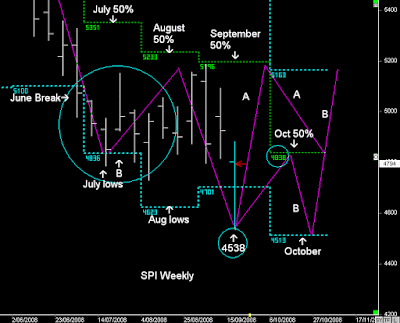
    2 plays for the rest of 2008 based on the lows this week.

    A set-up:- Bounce off the Yearly lows this week and moves back towards the September 50% level by the end of this month.

    Reverses back down into October 50% level finding support, and then continues higher over the next Quarterly timeframe towards 5355.


    B Set-up:- Wild Weekly swings into the end of this month, and markets continue down from October 50% level into the October lows because Resource stocks continue lower , forming a double bottom around October lows, and then markets reverse to close out 2008 higher.


    Which Set-up will occur???

    I don't know, but Set-up A wouldn't surprise me.


    As I have been saying for weeks, the markets had to come down lower in this Quarter before a 3 -month counter -trend move upwards, and finally that completed this week....

    However, any UP move in the next Quarter won't stop the inevitable:- globals market will go down into 2009


    Therefore how high we close in 2008, determines how far we go down into 2009, and global markets will go down in 2009

    Aussie ( SPI)Index Weekly 13th Sept 08

    "So far the Weekly cycle support has been verified @ 4830 with Friday closing above it, but the SPI probably won't continue higher until another 5-days of trading :-3rd week contract expiry.

    When looking at US markets they couldn't remain supported above their 3-week cycles lows, they actually closed lower, which often favours a continuation down."


    Previous Weekly Report


    SPI Weekly

    SPI was dragged down by US markets last week, with a 5-day choppy pattern remaining above 4830.

    This week is contract expiry, with December contracts running at a 45 point premium to the SPOT often sees the SPI move higher into Thursday and the day of expiry.

    How far the SPI will move is any one's guess, but a move back towards 5164:- 3 week highs is a probability.

    But after that I see don't see too much strength in Global Markets.

    October becomes interesting because of the drop in the 50% levels.

    I've mentioned before that I want to see lower prices in this quarter before a 3-month counter-trend move upwards, but if prices start trading above the forward Monthly 50% level in October, then the view is that the Aussie Market will begin a gradual rise upwards in a 'Monthly' step' formation towards 5355 in the next Quarter.

    SPI 5-day pattern

    Until then :- Day traders continue to use the 5-day levels and Spiral point set-ups each day.

    They are the most robust intra-day set-ups that you can use, because they operate with high statistical probability when using Swing and Momentum techniques.


    • Daily Trading Set-ups & Analysis
  • Index Futures SPI, DOW S&P, & Forex
  • Subscribe to the Trader Premium
  • http://www.datafeeds.com.au/premiumtrader.html


  • Aussie ( SPI)Index Weekly 6th Sept 08

    "Therefore:- like in April this year expectation still remains that September 50% level is resistance which could last for the next 2 weeks (more consolidation):- Ideal for spiral point trading and 5-day patterns.

    And if price does continue higher towards October's highs it should push higher in the 3rd week"


    Previous Weekly Report


    SPI Weekly chart

    Exact same pattern as April after the 3-week breakout on the Upside :- Price often reverses down and re-tests the 3-week cycle lows to determine how valid support is.

    And so far the Weekly cycle support has been verified @ 4830 with Friday closing above it, but the SPI probably won't continue higher until another 5-days of trading :- 3rd week contract expiry.

    But when looking at US markets they couldn't remain supported above their 3-week cycles lows, they actually closed lower, which often favours a continuation down.

    http://www.usindexweekly.blogspot.com/

    However, I still can't see a major 3-month counter-trend up move like April-May this year until lower prices bottom out in this Quarter.

    Therefore if it doesn't go down then it's more sideways price action, which suits me fine.


    SPI Daily and 5-day patterns

    I'm not concerned where the market goes in the short-term, as long as I trade the 5-day patterns using spiral point trading.

    When looking at the bigger picture we make certain conclusions of the trend and where price is likely to go.

    We also try and forecast the market in advance because of those same patterns repeating.

    Then we try and think in probabilities and find high probability patterns and trade them which fits in with the certain Weekly and 5-day parameters.

    As day traders, our job is to find patterns which rotate towards the 50% levels and then thrust outward as the trend continues within the Weekly and Monthly timeframes

    The current trends in Index markets are consolidating patterns with little trends. These patterns don't last long because eventually markets will move back into directional trends which last for 2-3 months.

    I still have the view that price will continue lower in this quarter but understand that markets don't move in straight lines, they zig-zag towards destinations ;- dynamic support and resistance.

    I'm also smart enough to understand the short-term timeframes using the 5-day pattern and adapt to the market, and continue to trade the same daily patterns of rotating and extending patterns within the 5-day range using high probability patterns:- Spiral Points (c)

    If you are day-trading the SPI or any other market, it's also imperative to monitor a number of different markets, especially Forex. Because what you see in the SPI, you'll also see in the Euro, AUD, GBP, JYP, DOW, S&P and so on......

    • Daily Trading Set-ups & Analysis
  • Index Futures SPI, DOW S&P, & Forex
  • Subscribe to the Trader Premium
  • http://www.datafeeds.com.au/premiumtrader.html


  • Aussie ( SPI)Index Weekly 30th August 08

    "Ideally I want to see a completion down in this quarter to bottom out the markets, so we can finally get a 3-month counter-trend move upwards.

    4th Week:- last week of the month often starts the next trend, which leads into the continuation of the trend in the following month, but who is not to say that next Week just continues higher"....

    Previous Weekly Report


    SPI Weekly and Daily charts

    I've been bearish on the market in this Quarter with the expectation that price would make lower lows in August before a 3-month counter-trend upwards would occur.

    But when certain things happen I have to acknowledge that a continuation downward in this Quarter might not eventuate.

    Even though price is still trading below the Monthly 50% levels in September, This week's 4th week rally and breakout of the 3-week highs normally shows further strength in the new month....

    SPI Weekly futures

    Above is the SPI Weekly futures showing the 3-week cycles (White line)

    Whenever price closes on the opposite side, the market often reverses the trend.

    It occurred in March and June, and now in August.

    The big difference between the two previous 3-week breaks and now are:- I had an overall view that price was reversing from March lows and moving into a 2-month rally into May's highs. In June I had the view that markets were coming down from May's highs into a lower low pattern in July.

    In August I don't have a view on any counter-trend move upwards.

    I do have the view of a 3-month UP move, but only if it made lower lows this Month, which it hasn't.

    Therefore:- like in April this year expectation still remains that September 50% level is resistance which could last for the next 2 weeks (more consolidation):- Ideal for spiral point trading and 5-day patterns.

    And if price does continue higher towards October's highs it should push higher in the 3rd week.

    Note:- Contract expiry this month.

    Expiry of contract normally supports the market or even push higher into Expiry.

    SPI 5-day pattern

    "Personally I hope it remains in a sideways pattern, especially when day trading futures....

    These markets are ideal for the way I trade:- consolidating trading patterns of weekly sideways price action favours swing trading, which is the core theory of spiral point trading (c).

    There is enough volatility in the market that it moves 87 points and not just 44 points.

    When markets trend in one direction, the frequency drops and volatility drops especially when Market rise, not so much when markets go down.

    The end result in trending markets are, my profits drop because my frequency of trades drop"


    And last week's 5-day pattern in the SPI was ideal and text book spiral trading, and hopefully for the next two weeks it remains the same.....

    Aussie ( SPI)Index Weekly 23rd August 08

    SPI Weekly and Daily charts

    Australian Index is consolidating in a sideways pattern over the past two months.

    Ideally I want to see a completion down in this quarter to bottom out the markets, so we can finally get a 3-month counter-trend move upwards.

    I was hoping that US markets would leads us down (Read US Weekly Report), but Friday in the US moved higher.


    At this stage the June breakout and Monthly 50% level are still view as resistance until they breakout, and they will breakout:- But my breakout starts with a touch of the lows before price usually continues higher.

    I've mentioned previously that any UP move will begin with US markets leading the breakout, and that remains, so at this stage the view remains more consolidation unless the last Week of this month continues higher.

    4th Week:- last week of the month often starts the next trend, which leads into the continuation of the trend in the following month, but who is not to say that next Week just continues higher....

    Personally I hope it remains in a sideways pattern, especially when day trading futures....

    These markets are ideal for the way I trade:- consolidating trading patterns of weekly sideways price action favours swing trading, which is the core theory of spiral point trading (c).

    There is enough volatility in the market that it moves 87 points and not just 44 points.

    When markets trend in one direction, the frequency drops and volatility drops especially when Market rise, not so much when markets go down

    The end result in trending markets is my profits drop because my frequency of trades drop.

    Hopefully markets don't go up yet.....


    • Daily Trading Set-ups & Analysis
  • Index Futures SPI, DOW S&P, & Forex
  • Subscribe to the Trader Premium
  • http://www.datafeeds.com.au/premiumtrader.html


  • Aussie ( SPI)Index Weekly 16th August 08


    Australian Cash Weekly charts

    Currently Range bound this Quarter trading below the breakout of June's lows, and at this stage there is an expectation that in 2008 prices will move lower before they bottom out....

    Commodity prices are moving lower, which are weighing heavily on our Resource stocks, even though BHP will announce a record profit next week...

    SPI WeeklyFutures

    Markets have stabilised and have moved into a sideways pattern, underpinned by US markets moving higher and reporting season.

    BHP reporting on Monday and some financial stocks reporting this month supporting the market.

    SPI Daily

    We can see how congested the market is this month, and at this stage I can't see any difference next week.


    Next Week:- Range bound which will be heavily influnced by US markets, but Monday should be driven by the market's reaction to BHP record profit announcement.

    Any new down trend won't occur until US markets lead..... (Read US Weekly Report) , and dragged down by Financials to bottom out the market.

    Aussie ( SPI)Index Weekly 9th August 08

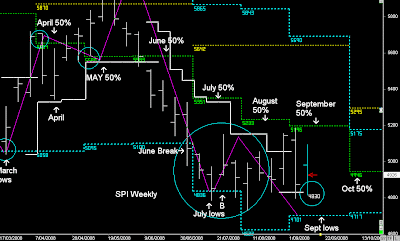
    "July's lows supported the market, and if the market was going to go higher, then it was based on the open of August and it's direction based on the midpoint @ 5000.

    As mentioned in last week's report:- an open below that level in August and expectation price is moving down towards August lows, as it follows the B setup.

    Day traders:- simply trade the 5-day levels using Spiral point techniques"

    Previous Weekly Report


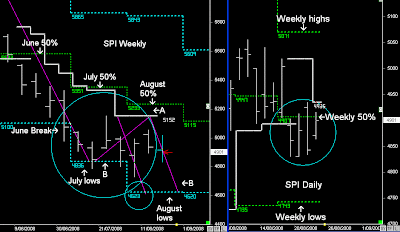
    SPI Weekly and Daily charts

    The Aussie Market opened below 5000 at the start of August and began the next wave down, as part of the B Set-up, continuing down into the Weekly lows completing the first stage of the sell pattern.

    Whereas in the US, those markets closed above their 50% levels, which favoured a rise higher into Friday

    (click link to read DOW and S&P Weekly Reports)

    http://www.usindexweekly.blogspot.com/

    Often global markets move in unison, we saw this in the lows in March, the lows in July, but the 'pop' upwards in August wasn't aligned in the Australian market compared to the US markets.

    Most of the UP moves in the market were because of the US markets continuation higher providing the higher opens.

    Next Week:- price is trading above 5000, and the short-term view is to continue higher into the Weekly highs @ 5159, and could go as high as 5233 (following Week)

    Ideal pattern would be a test and reject pattern from the Weekly 50% level.

    After that completes I don't have a long term view on the market for another 5-days.

    • Daily Trading Set-ups & Analysis
  • Index Futures SPI, DOW S&P, & Forex
  • Subscribe to the Trader Premium
  • http://www.datafeeds.com.au/premiumtrader.html

  • Aussie ( SPI)Index Weekly 2nd August 08

    XJO Weekly Charts

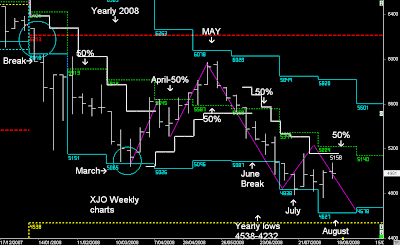
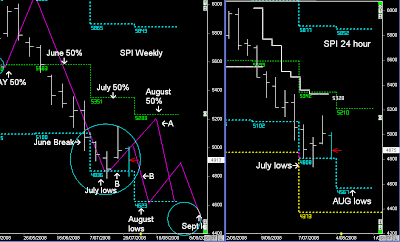
    The Aussie Index is moving down into the Yearly lows, which will probably be reached in September.

    From the Time price was trading below 6213 (Bear Market :- Dilernia Principles), the downside target in 2008 were the Yearly lows.

    And along with support, swing patterns, trends, resistance, and cycles:- the market structure was precisely mapped out based on the timeframe parameters defined by the Dilernia model.

    Price doesn't move in a straight line, it zig-zags its way based on waves of 'Time'. A support level is valid for the current timeframe, once that timeframe ends the levels of support 'shift' and dynamically move forward, allowing the trader to have a trading model that is forward looking.

    As is the case with July's support:- vaild for the current monthly timeframe but shifts forward at the start of the new timeframe. What support that existed in July won't be valid in the month of August.


    SPI Weekly and 24 hour charts

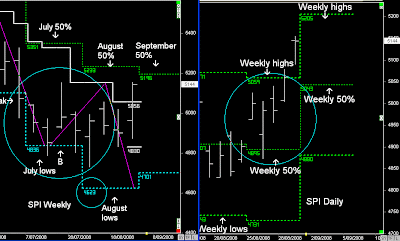
    Expectation is that the Aussie Index is moving down into the Yearly lows around 4538which is starting to align with the August lows.

    I've put up both charts showing a difference in levels with the August lows, and if the SPI ends up lower it will probably occur in September, which could push lower based on the next monthly dynamic range, but I'll come back to that in 4 weeks time.

    September could see the market as low @ 4373.

    I can see the aussie market around that level in September, but I'd be surprised to see the market much lower in 2008. However, I do expect a lower low in 2009, which will be determined by the closing price of 2008 on the last day of the year.


    SPI Daily and 5-day pattern

    July's lows supported the market, and if the market was going to go higher, then it was based on the open of August and it's direction based on the midpoint of August @ 5000.

    As mentioned in last week's report:- an open below that level in August and expectation price is moving down towards August lows, as it follows the B setup.

    Day traders:- simply trade the 5-day levels using Spiral point techniques.


    • Daily Trading Set-ups & Analysis

  • Index Futures SPI, DOW S&P, & Forex

  • Subscribe to the Trader Premium

  • http://www.datafeeds.com.au/premiumtrader.html


  •