SPI Weekly Report part 2 :- 30th Jan 2008

~~~~~~~~~~~~~~~~~~~~~~~~~~~~~~~~~~~~~~~~
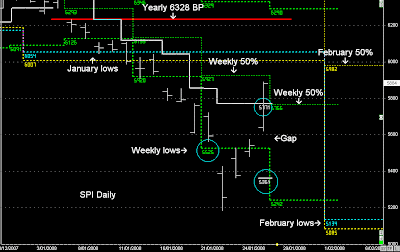
Price is still trading below January lows, and therefore it's still in a monthly 'downward-break', and this massive reversal is simply a 'dead-cat' bounce within the Weekly timeframe. Until Price moves above the February 50% level then trend remains down.

Next week:- a move under 5771 and price will move back down to 5580 (gap closure and Quarterly support) Whenever the market closes above the 3-day highs, like it did on Friday, there is always an expectation of a reversal back into the break (5771), and because there is such a large gap to the 3-day lows, a downward move to 5580 is a high possibility before any UP move occurs.


Weekly report 26th December 2008

SPI has completed the gap closure @ 5580 in the first two days of the trading week.

A bullish set-up will move higher on the 3rd day;- if it moves above 5771 in the 2nd half of the Week I favour a move upwards towards the February 50%.

There is only 1 day remaining until the end of the trading month.

And it all depends on US market on Wednesday, because a failure of a rate Cut and US markets will probably move lower, and the SPI will probably open below the 3-day lows @ 5477. (change of 3-day cycle again)

We can already see any further potential weakness in February.....(February 50% resistance)

SPI Weekly Report 26th January 2008

~~~~~~~~~~~~~~~~~~~~~~~~~~~~~~~~~~~~~
If the market moves down into a ‘blow-off’ bottom in this quarter then I expect a massive counter-trend move upwards back towards the 3-month highs before the next major sell-off down later this year…

If we subscribe to market dynamics and price following TIME and PRICE modelling using my methodology, then YES this can be major support, and Yes markets can reverse upwards, but this time any reversal upwards is going to be limited, and any further move down is going to occur in the forward Quarterly timeframe.... (previous Weekly Reports 19th January)


We got the blow-off bottom this week, followed by a massive counter-trend move upwards.

When we look at market dynamics and the higher timeframe levels, the market looks supported and my expectation that price will remain range bound between the two January levels of 6043 and 5575..

When we look at the reversals in the market from any highs, each sell down is occurring from 3-month highs...therefore any further weakness in the Australian Market and my view is that price will have a better chance of the Market moving lower in the forward Quarterly timeframe from April highs...

In 2007 the market dropped heavily and bounced, and then made higher highs, but that was a corrective move within a Yearly bull-trend based on the Dilernia model.

In 2008 it's different, and I'm still hypothesizing further weakness in the latter part of 2008 because of the Yearly timeframe.

The SPI this week followed the 'Crash-pattern' and reversal back towards the 3-day highs and the Weekly 50% level.

The High in Sycom on Friday was 5927. The Weekly 50% level is 5927.

Price is still trading below January lows, and therefore it's still in a monthly 'downward-break', and this massive reversal is simply a 'dead-cat' bounce within the Weekly timeframe. Until Price moves above the February 50% level then trend remains down.

Next week:- Price will open above the 3-day high break and the Weekly 50% level (5771), therefore it has more chance to move higher with only a couple of days left of 'January-Resistance', price can easily move higher in February towards 6043

However a move under 5771 and price will move back down to 5580 (gap closure and Quarterly support)

Whenever the market closes above the 3-day highs, like it did on Friday, there is always an expectation of a reversal back into the break (5771), and because there is such a large gap to the 3-day lows, a downward move to 5580 is a high possibility before any UP move occurs.


Friday's trading was about price moving upwards into 5771, and all I wanted the entire day was to see a 44 point reversal in the market, and then rise upwards from the lower spiral point...that didn't occur until 5736, and the market took off into the close and back towards the 5-day highs @ 5875...

Next Week:- is about trading down into 5771, hopefully from a higher 44- point top and then see how price reacts to the Weekly 50% level whether we trade upwards towards the February 50% level or down into 5580....


Information is owned and coyprighted and cannot be reproduced without consent

SPI Weekly Report 19th January 2008


This year started with the first week trading just above the Yearly balance point (50%). The Yearly timeframe is the driving force behind major global trends, and once under the Yearly balance point, price was coming down to these levels, as price pushes away from the Yearly balance point and moves towards the outer channels of the Quarterly timeframe.

Every time the market gets down to these levels, the market reverses upwards and continues with the overall trend. But each time in the past, the market was trading above the Yearly balance points, not in 2008.

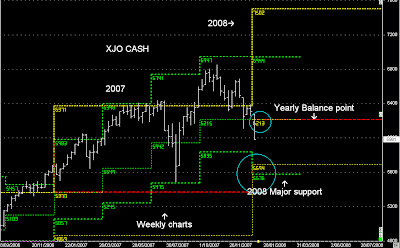
If we subscribe to market dynamics and price following TIME and PRICE modelling using my methodology, then YES this can be major support, and Yes markets can reverse upwards, but this time any reversal upwards is going to be limited, and any further move down is going to occur in the forward Quarterly timeframe, which is mapping out price down towards 5203 from April 2008.

Therefore using the Dilernia Theory: - price rotation down into outer channels (we are here now), rotate back up into 6027 over the next 2 -months, and then move lower from the 50% levels down into lower prices in the forward Quarterly timeframe…
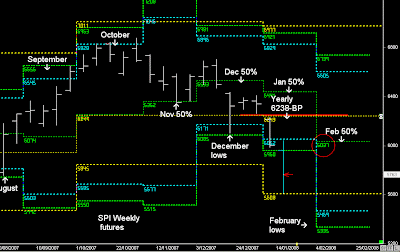


We always start with the larger Timeframes first, and then move into lower timeframes and use the exact same theory.

However the theory in general doesn’t always follow the precise methodology, because it only takes one event or outside influence to change things.

For example, the expectation was always that price was moving down into these lower levels, but using timeframe modelling and the monthly timeframe, this next sell-off had a higher probability for price to head down not in this month, but the next month as it follows the February timeframe lower, in step formation.

Just as it does on the upside, the continued sell-off was modelled to continue lower next month.

And that 1 event that sped things up was the US markets continued sell-off this week, dragging the Australian market down much quicker than expected, but not unexpected.

In conclusion: - Any upside this month and my expectation that price will find resistance around the January Monthly breakout (lows), and then the February 50% level is going to be the next trend guide in the forward monthly timeframe.
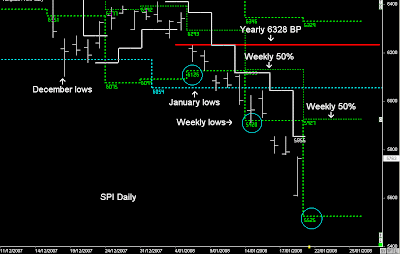


When we begin to look at the shorter timeframe based on Daily and Weekly, we see the exact same price patterns in the market:- Support- Rotation- Break, and then Price continues with the overall trend of the much higher timeframes….

Therefore next week:- Resistance Weekly 50% level, further downside in the Weekly lows @ 5525.

The downside trend won’t officially stop until price moves back above the 3-day highs and breaks the Weekly 50% level, regardless how much support exists around these current lows

And then as Day traders we use the 5-day patterns to trade and minimise risk along with Spiral points, as price moves with the overall trends of the market from one higher timeframe level into the next, and then reverses upwards.

In this case 5-day lows, 5-day 50% levels, and/ or 44 point spiral bottoms and tops.


Last Word: - We need to analyse and hypnotise the larger timeframes, but we don’t necessarily have to trade them. We simply utilise the overall market direction and trends to minimise risk.

For example:- this week I bought banking stocks, I think the levels I bought ANZ, CBA, and WBC constitutes fair value and price using my modelling. Since banks were floated in the early 1990’s these banks have probably spent less than a few weeks below these dynamic levels. (The Stock Report)

During the past 17 years we have seen the Asian Crisis, Tech Wreck, September 11, the bear trends in 2001-2003, and every other financial storm, and those three banks have remained above those levels every time.

Based on my modelling and Risk assessment, I waited until these levels to BUY into banks, and not anytime sooner , however I haven’t bought banks using Margin positions, only cash.

When it comes to futures, I still need to understand the market from the top-down and use support and resistance along with the overall trends in the market.

The last time US markets collapsed like this in 2001, the Australian market remain supported at the same dynamic levels we are now for the rest of the trading year before falling the following year.

The US markets will probably go down more, but I think there needs to be a major counter-trend move back towards the 3-month highs (over time) before the next major collapse into Yearly lows ( read US Weekly Report)


Please Read the Daily reports…

All information is owned and copyrighted by Frank Dilernia
SPI Trading Weekly 17th January 2008

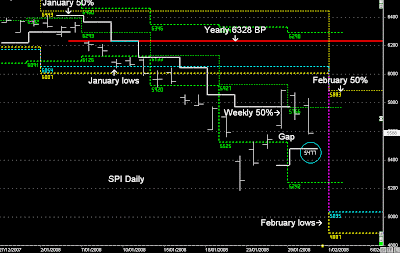
SPI has continued down into this level quicker than expected, but not unexpected.

The move down has been driven by US markets, and that move down was already forewarned in the US weekly report, and now i'm expecting a counter-trend move upwards. (if Thursday breaks higher)

I personally wanted a blow off bottom in the Australian market, but I think that with this low today, US markets probable up move this week, the expectation that over the next few weeks will be a swing back towards the Yearly balance point
@ 6328, and where all it started...

I've been picking up banking stocks this week, and picked up my last banking stock CBA today on it's lows....

Note:- I'm not expecting a new UP trend to devlop for the rest of the year, all I'm expecting is a counter-trend move to the Yearly balance point....

SPI Trading Weekly 12th January 2008

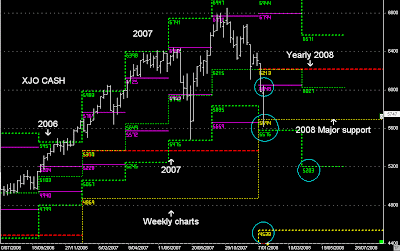
Australian Stock market is heading down into 2008 major support during this Quarterly timeframe.

Once price opened below the Yearly Balance point and started moving down on Monday, the next level down target is nearly 600 points away...and my expectation is that price will make it's way towards those levels during this Quarterly period.


Price action during this month has followed the Dilernia principle of a two wave pattern lower into January lows. Around these levels there is an expectation that the market will find support.

It is a repeating pattern that around these levels, whether in rising UP-trends or moving Down-trends the market will find support, moving into a consolidation pattern for a number of weeks, before the next wave down occurs in the forward monthly timeframe, as each wave pattern moves within the monthly timeframe.

Last week's report was based on the market trading either side of the Yearly balance point:- below and it was heading down into the January lows.

This price pattern has just completed a 2-month lower low wave pattern. This pattern often provides the springboard for major reversals in the market, and the UP trend continues higher.

This is often confirmed once price is back above the Weekly 50% level. This price action of a 2-month lower low has resulted in major down trend reversals, and the Bull-trend continues.

However, all these major reversals using this pattern have been occuring in Primary BULL trends:- Price trading above the Yearly Balance point.

This isn't the case now:- it is the first stage of a bear market unfolding, but that is only confirmed with a monthly close below 'MAJOR Support'

The Primary Trend is the driving force in the market, over the past 5-years, it was safe to move into margin positions on stocks around these levels and ride the trend upwards over the next 3-6 months and more.

But in 2008, the risk of trading Margins positions at this level is still open to RISK.

When we look at the Dilernia Model, the expectation is that from the break of the 5-day lows on Monday @ 6231 the market was heading down into January lows.

The Trend was down:- therefore the highest probability trades during the week were the R44 'spiral tops'.

In fact, every higher R44 spiral point resulted in a high probability follow through:- Each point provided a huge edge when trading the overall trend of the market. This was because of the trend of the weekly direction, and where price was travelling from, and where it was going.

If January lows becomes a multi-week support zone until February, then the r44 spiral points will be just as robust, but the expectancy of every R44 spiral TOP is going to drop down into it's historical average of around 75%, and not sell-off from every top like last week.

The spiral bottoms in a consolidating Weekly timeframe will be just as important when trading the 'MONEY PATTERN'

In Conclusion:-

The Overall Market is heading Down during this quarter, and probably go lower.

Expectation that January lows will support the market and move into a multi-week sideways pattern, with the next down move occuring in February.

The Trading range next Week will be defined by the Weekly 50% level (Resistance)

And the Spiral-Points will be the best day-trading edge in the market without a doubt.

What the Dilernia Model © is for Trend-Trading, Spiral-Points © are for Day-Trading


Please refer to the Daily reports

All information is own and copyrighted by Frank Dilernia and cannot be reproduced without consent

SPI Trading Weekly 5th January 2008


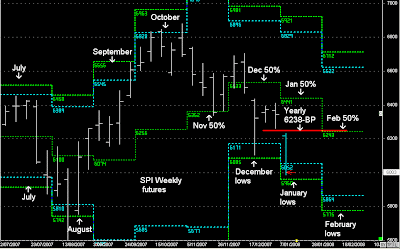
Above is the SPI Futures Weekly chart...

Last week price was range bound between the January 50% level and the Yearly 50% level, with each day rising upwards from lower opens, and reversing down from higher opens or anytime it got close to Monthly 50% levels.

Next week with US markets falling, the SPI will open below the Quarterly 50% levels and Yearly BP. This will be the first time since 2003 that price is below the Yearly 50% balance point.

We can also see a shift in timeframes and January lows are lower than December, and a reference for any potential weakness next week.

Last Week ended up closing in the middle of the 5-day range after 6295 ended up supporting the market, and this is an important level next week for any UP move, because above 6293 price will be back above the Weekly 50% level, as it has shifted lower from 6392 down to 6293

The Weekly 50% level:- is a reversal target early next week, above it and market is heading back to the 3-day highs and January 50% levels. The latter might take the entire week for this to happen. (Higher Weekly close)

Because on Monday we have 'gap-Trading' probability once again, with the expectation that the gap will close on Monday and reverse back into the Weekly 50% level.

If this is the case, then price will back above the Yearly and Quarterly 50% levels, and if there are any upside moves in the US next week (refer to the US weekly Report), this is going to push the SPI higher also....

In conclusion:- I'm leaning to a bullish Weekly timeframe if the first part of the 'gap-trading' eventuates, and then US markets rotate upwards from support towards their own Weekly 50% level.


When we look at the Weekly chart of the XJO (CASH) the Weekly timeframe from 2007 has just completed. The open on Monday will officially start the Weekly timeframe for 2008, and this has confirmed the 'Primary balance point' of 6213.

Above 6213 in the cash market and Primary Trend remains UP....

In Conclusion:- SPI Futures will open below all timeframe 50% levels on Monday, this is extremely bearish. The potential to move down into lower lows is highly probable:- open outside 6231 and the 5-day lows (bearish)

However, on Monday I'm favouring longs based on 'gap-trading' probability with a swing back towards the Weekly 50% levels. If the market is going to move down, then it will fail here and move down from this level.

If the market swings back towards the Weekly 50% level on Monday, and then opens above it the next day, I favour a weekly timeframe that closes higher, as it rotates back towards January 50% levels:- Next Week's Risk level is 6293

Please Refer to the Daily reports "the Trader Trading" for Monday's trading:-

Premium Report:- market opening below 5-day lows @ 6231, be careful on 22 point UP move and then failure outside the 5-day range lows:- reversing down taking out the lows.

Do not trade longs if this is the case on Monday, as expectation price is heading down towards the January lows...