Aussie Index (SPI) 30th April 2011 Weekly

SPI Primary (2010) and Secondary cycles (2011)

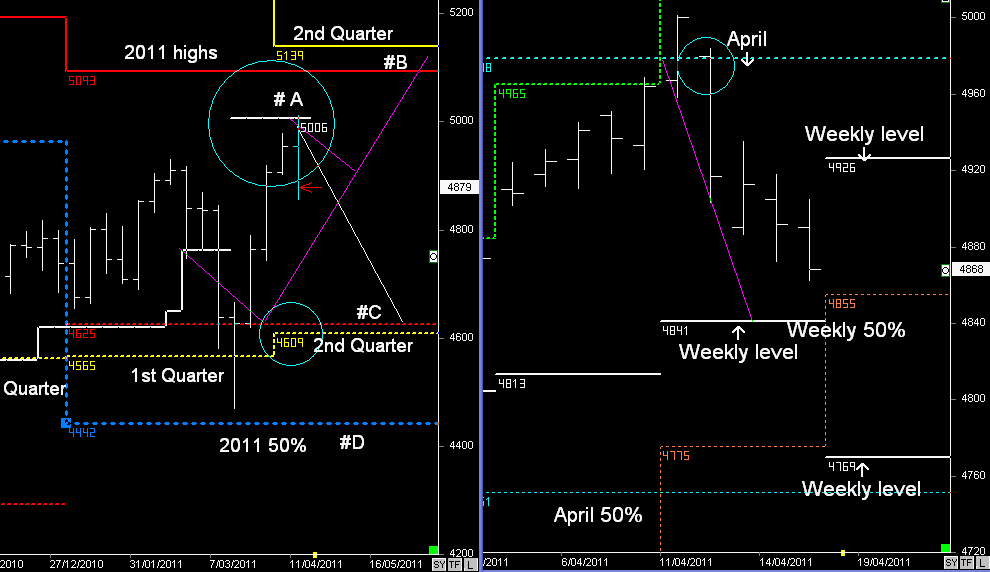
  As mentioned at the start of April, the market was either going to continue lower...

                                                                        or

 because the S&P 500 had remained above key support levels (Fake break), it was more likely going to continue to consolidate until the start of MAY, and then try and make another move towards  new highs in the 2nd quarter (5093-5193)

As we can see in the above right chart, the market has moved down into this Week's lows, and next week’s lows now match the MAY 50% level. (Critical Support)

The current price action suggests that the Market may continue towards new highs in
the 2nd quarter @ 5093 to 5193,  once Support has been validated ( doubleWeekly low pattern)

However, keep in mind we had the same pattern in 2010, when the market reversed down from the April highs, and by the 2nd day support levels failed in MAY (left Chart), on the back of weakness in the S&P 500.

What’s the difference this time?

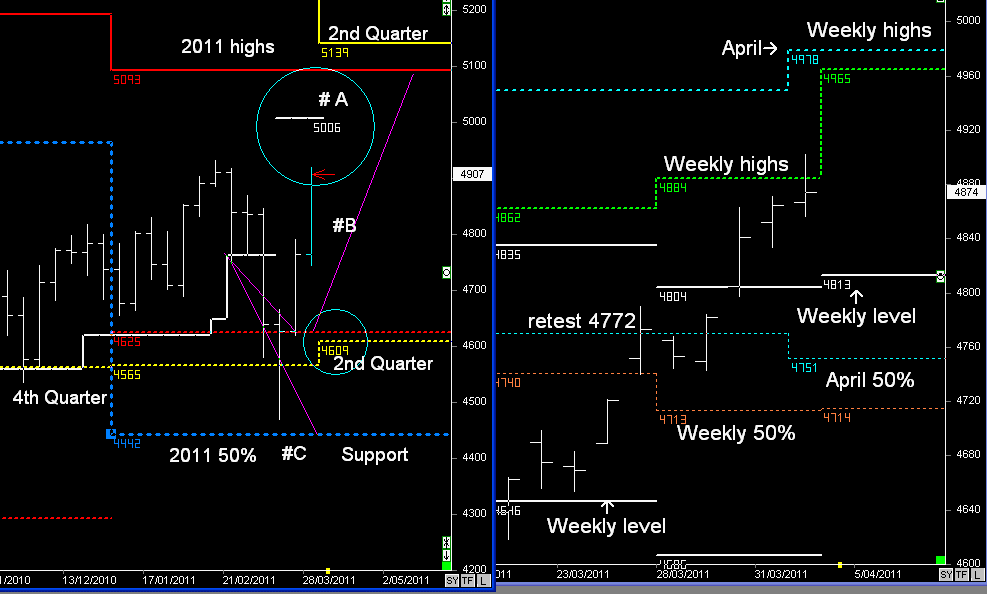
The Primary cycles in the Aussie market are different, in 2010 we were below the 50% level, whereas in 2011 we are above, so there’s more reason for the trend to continue higher during the current Primary cycle.

The S&P is also above the Yearly highs (1301-1331), whereas in MAY 2010, the market opened below the Yearly highs and sold off on the first day of MAY (flash crash)

And currently, US markets continue with QE2 until the end June, which can help underpin
 the current upward trend in US markets.

In conclusion:- be aware of any weakness below the MAY 50% level

Aussie Index (SPI) 23rd April 2011 Weekly


SPI Primary cycle and Weekly ranges

The SPI continues to consolidate in April coming into MAY, as the S&P 500 continues to remain above support levels.

As noted in last week’s report….


There are two possible patterns, and that will depend if the S&P holds support levels.


If it does hold support, then I’ll look for the next push upwards from MAY, as the market ‘chops’ around for the next 3-weeks (SET-UP B) towards 5093 to 5139


If it doesn’t hold support, and the S&P moves back down towards 1247-54, then the SPI can makes its way back towards 2nd Quarter Support (SET-UP C)


Therefore there’s 1 week left to go in April and the market continues to consolidate within the Weekly levels…

A bearish pattern will only appear if the S&P is once again trading below the weekly levels, and the SPI is trading below 4801

Aussie Index (SPI) 16 April 2011 Weekly

The SPI has moved up into the monthly highs in April @ 4978, and in my opinion has hit resistance levels and will begin to rotate lower over the coming weeks, and move back down towards the lower Weekly levels.

Previous Weekly Report


SPI Primary & Secondary cycles.


Market Top @ 5006 on Monday, and expectation that the reversal pattern would occur is currently playing out

Even though I have a view that the trend bias is up towards 5093 to 5139, that’s more likely going to happen after there's a reversal pattern down from these April highs.

There are two possible patterns, and that will depend if the S&P holds support levels (above 1300-1304).

If it does hold support, then I’ll look for the next push upwards from MAY, as the market ‘chops’ around for the next 3-weeks (SET-UP B)

If it doesn’t hold support, and the S&P moves back down towards 1247-54, then the SPI can makes its way back towards 2nd Quarter Support (SET-UP C)

Next Week:- At this stage I’d treat the Aussie market as consolidating within the Weekly levels, using the Weekly 50% level as support.

And keep an eye on if there's a daily close below 1299 in the S&P500

Aussie Index (SPI) 9 April 2011 Weekly

It looks like the SPI will continue to follow the double Weekly high pattern and towards the April highs.

Previous Weekly report


SPI Monthly and Weekly


Overall target during the current quarter remains 5093+


However, the SPI has moved up into the monthly highs in April @ 4978, and in my opinion has hit resistance levels and will begin to rotate lower over the coming weeks, and move back down towards the lower Weekly levels.


Depending on where the market is at the start of MAY, and if it's trading near the monthly 50% levels, then the next move upwards will align with support levels matching in the following month


Basically, I think buying into the market at these levels is open to risk, and I would prefer to wait for the market to rotate back down over the next 3-weeks into trailing support levels


Aussie Index (SPI) 2 April 2011 Weekly

The current price action is a retest of breakout of the Weekly lows @ 4772 and also the Monthly 50% level, which on most occasions will push the market back down.

However, the price action in the S&P 500 on Thursday suggests more gains, which can push the Aussie market higher in the short-term, if it begins trading above 4804
. .

Previous Weekly report.


SPI Yearly and Weekly

As mentioned in last week’s report, it was the price action in the S&P that was showing signs of dragging the Australian market higher, and once above 4804 the trend followed the Weekly highs.

Next Week….

It looks like the SPI will continue to follow the double Weekly high pattern and towards the April highs.

However, based on the price action on Friday, we could begin with a 2-day reversal back down towards the Weekly level @ 4813

Our overall target for 2011 remains 5093, and as high as 5139