SPI Futures Australian Stock Market 27th August 2011 Weekly report

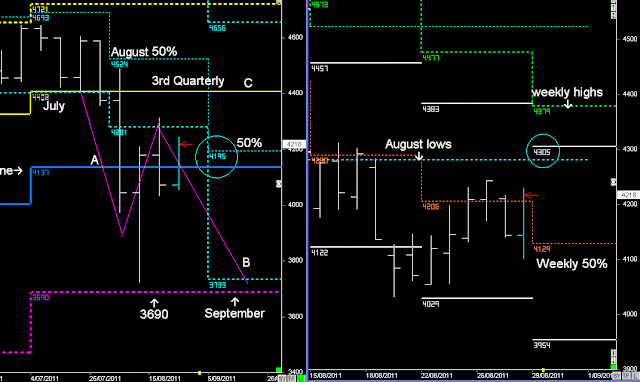
It won't surprise me to see the SPI inside the Weekly channels (above 4029), simply because the S&P 500 remains supported around it's August lows @ 1115 until September.

Previous Weekly Report


SPI Monthly and Weekly cycles

The Australian Market remains supported above 4137, as the S&P remains above the August lows @ 1115


Next Week:- the Australian market could move back down into the Weekly 50% level @ 4129, but my hunch the trend continues to move upwards.


Once the next 5-days are over, then the week after next will let us know whether the trend follows the September low pattern using the Monthly 50% level as the trend guide....

 Or continues upwards and back towards 4405, using the September 50% level as the trend guide.


My view is that is going to continue down towards the September lows, and if that happens then my bet is that Obama will announce QE3 somewhere around those September lows (double bottom) which will underpin (support) the trend for the rest of 2011

The Australian Stock Market (SPI Futures) 20th August 2011 Weekly

Next week begins the 3rd Week, and if it follows last week’s report, then the market should continue to  upwards over the first 3-4 days.

This is part of retesting the previous weekly breakout @ 4321, if that happens then traders should move into short- positions from Thursday onwards.


Previous Weekly report

SPI Monthly and Weekly cycles

The SPI moved upwards for the first 3-days and retested the previous Weekly breakout and then got sold off on Thursday using the August lows as resistance.

I was expecting higher highs around 4405 by Thursday's open, but that was mainly due to the S&P 500 failing to follow the same 3-day rally pattern.

The current price action was written 3-weeks ago, and described in my new book, and so far it's following the text book patterns...

And if it continues to do so, then the SPI will move down towards the September lows in the following month.

Next Week:- In the short-term if it's below 4029 the trend bias is down....

However, it won't surprise me to see the SPI inside the Weekly channels (above 4029), simply because the S&P 500 remains supported around it's August lows @ 1115 until September.

Read US Index report (S&P 500)

The Australian Stock Market 13th August 2011 Weekly

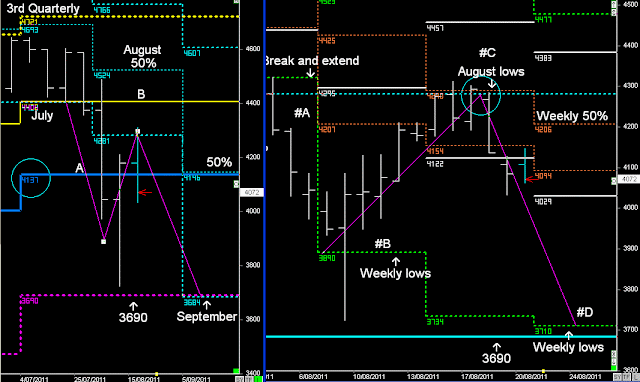
The Weekly lows @ 3890, will complete the break and extend pattern from last week's lows @ 4321.


Once that pattern has played out, then we look for the following week (3rd Week) for a possible larger reversal pattern upwards, which could take the market as high as 4405 (#B).


If that plays out, then we look for another leg down in the 4th week of August into the September lows


SPI Monthly and Weekly cycles

Last Week’s price action was exaggerated on the news of the credit downgrade in the US, but we completed the break and extend pattern into the Weekly lows @ 3890, which was part of the original analysis (#A into B#)

Next week begins the 3rd Week, and if it follows last week’s report, then the market should continue to rally upwards over the first 3-4 days.

This is part of retesting the previous weekly breakout @ 4321, and could be as high as 4404 by next Thursday. (#C)

If that happens then traders should move back into short positions

However, I could be totally wrong about a 3rd week rally, and if the market begins to trade below the weekly levels @ 4122, it could put pressure on the market once again, simply because price is trading below the August lows.

The Australian Stock Index Report 6th August 2011

SPI Monthly and Weekly cycles


Weakness in US markets over this 5-day cycle has seen the Australian market move down and close below the Primary BUY support level @ 4137, helped by the August 50% level rejection pattern.

Extremely bearish whilst the market is below 4137, and this could see the trend continue down into 3690 by September.

In my new book there is a section on the current market conditions from pages 120 to 130, that spells out the possible price action over the next 2-3weeks, and this will be heavily influenced by the price action in the S&P 500 (read US Report http://usindexweekly.blogspot.com/)

That means over the next 5-days, the market can rise upwards early next week, reach the Weekly 50% level @ 4207, but then continue down into the Weekly lows.

The Weekly lows @ 3890  (Day session @ 3951), will complete the break and extend pattern from last week's lows @ 4321.

Once that pattern has played out, then we look for the following week (3rd Week) for a possible larger reversal pattern upwards, which could take the market as high as 4405-4442 (#B).

if that plays out, then we look for another leg down in the 4th week of August into the September lows.

In conclusion:- Whilst the market remains below the Primary BUY zone @ 4137, longs are open to risk


Footnote:- This week's report was written before Standard and Poor downgraded the US credit rating from AAA to AA+, how it changes the analysis over the next 5-days is yet to be seen