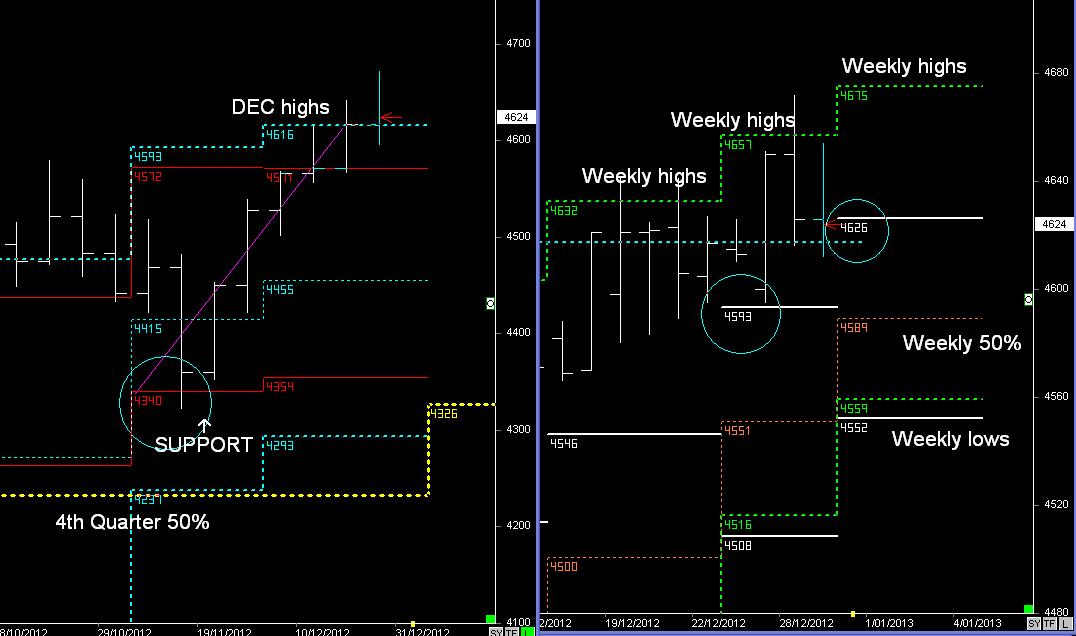
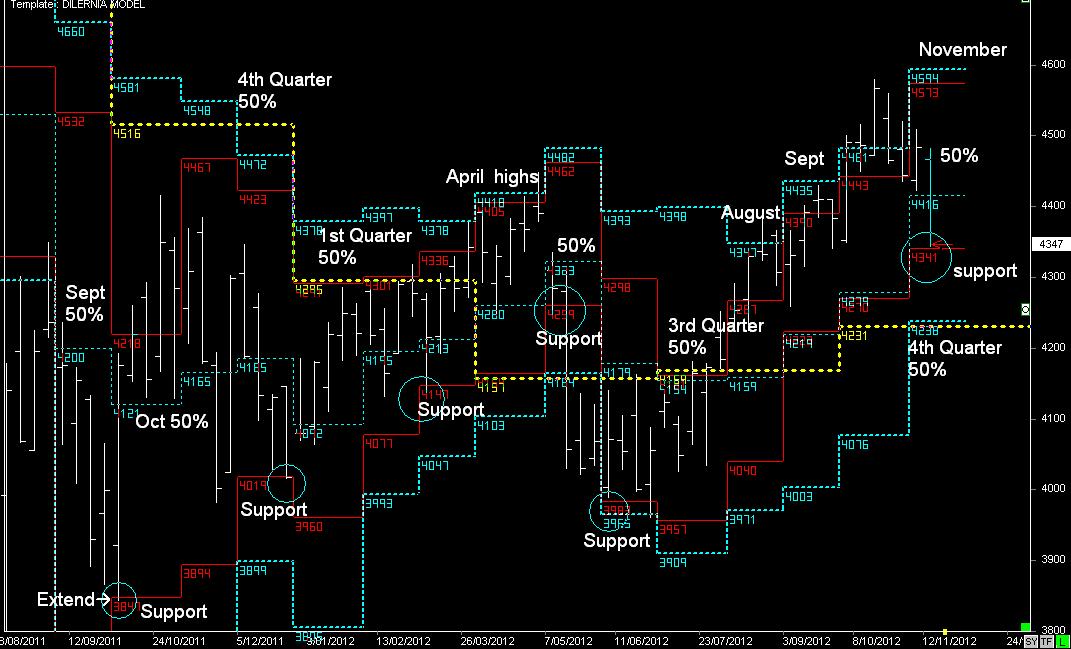
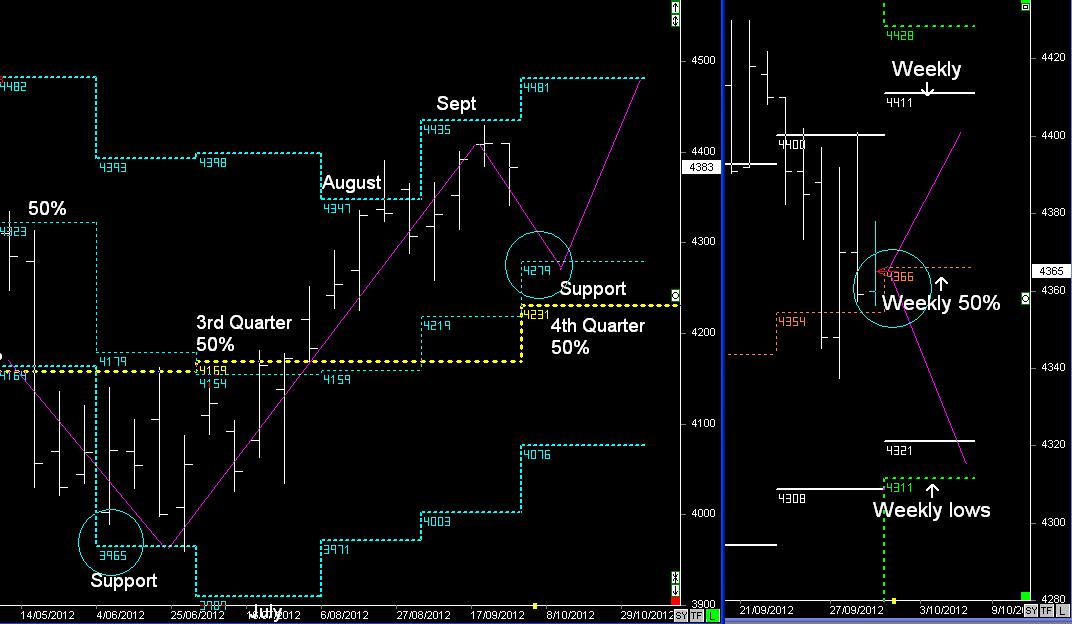
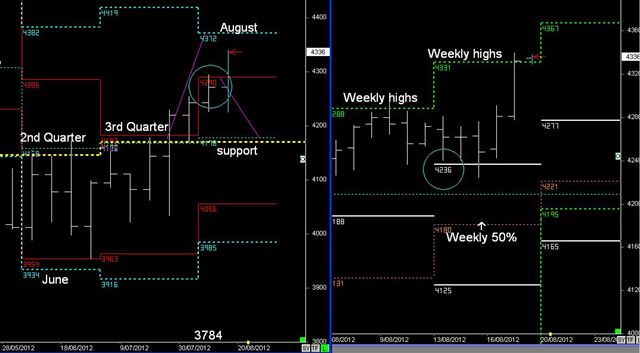
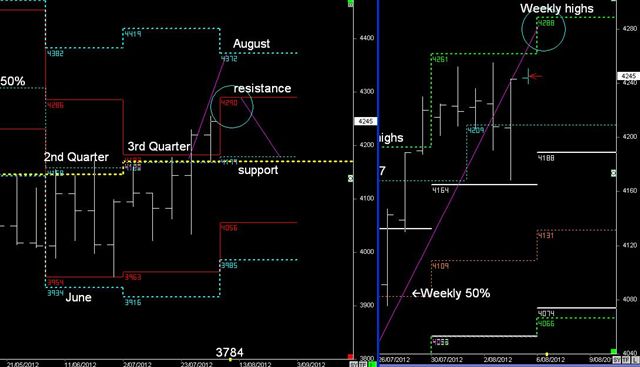
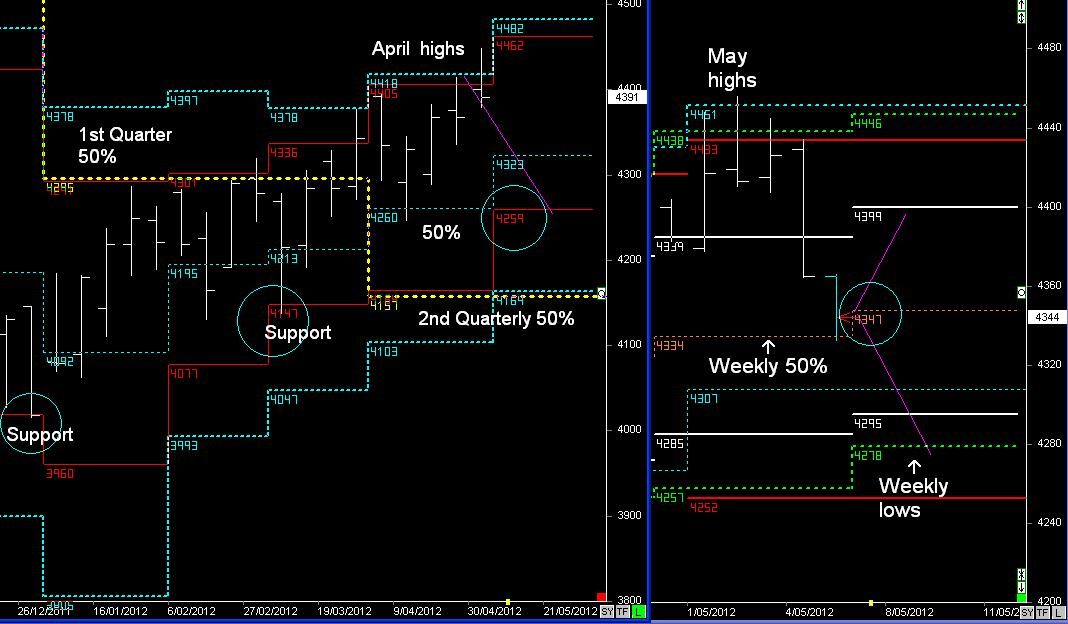
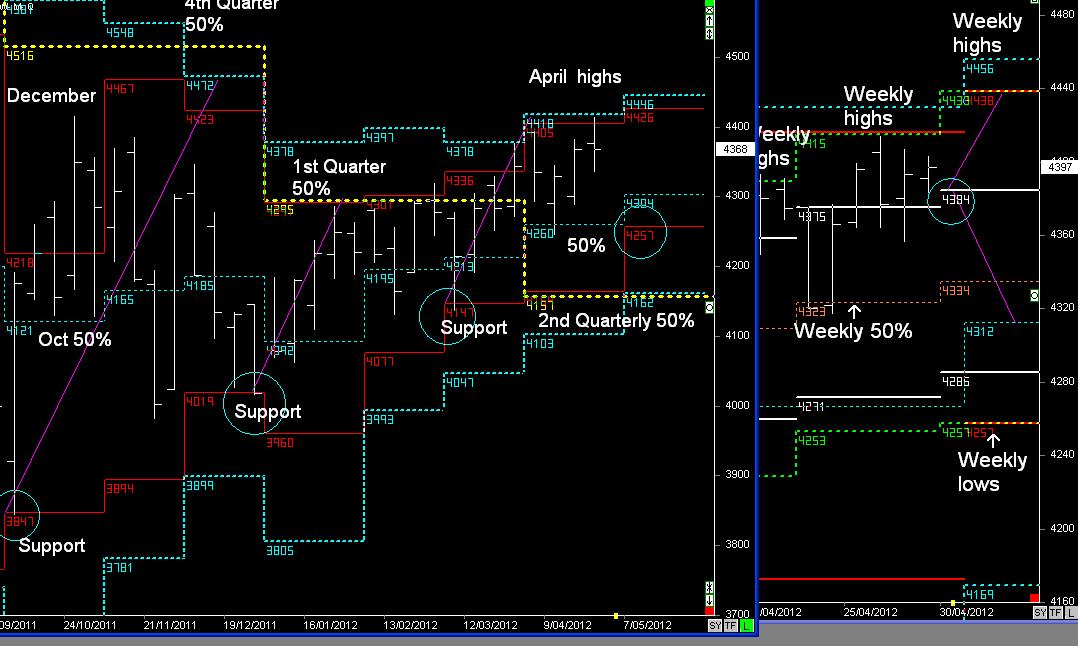
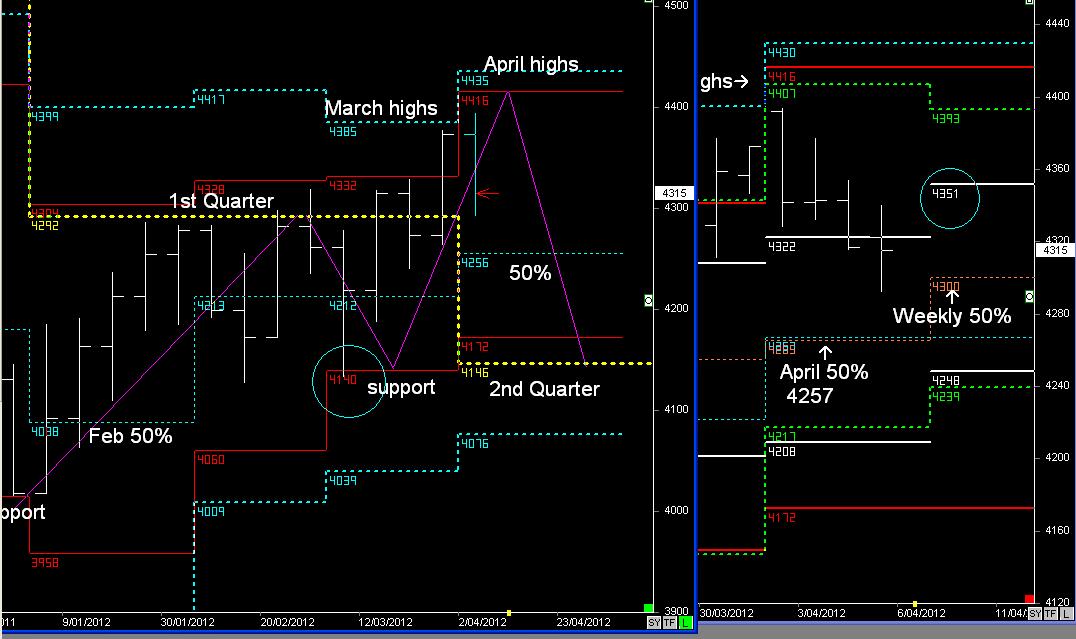
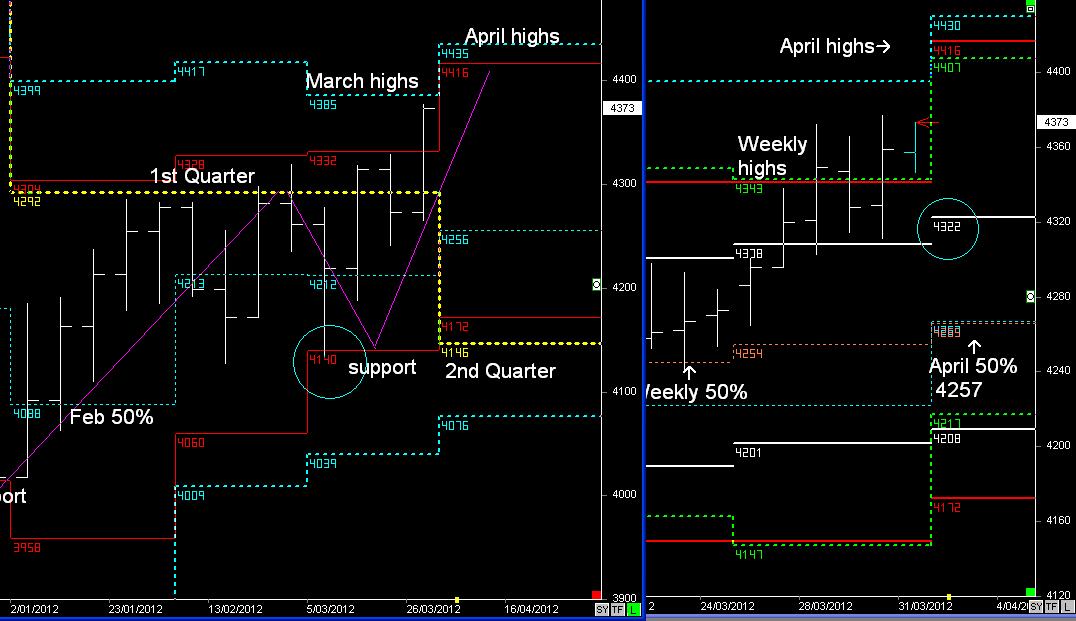
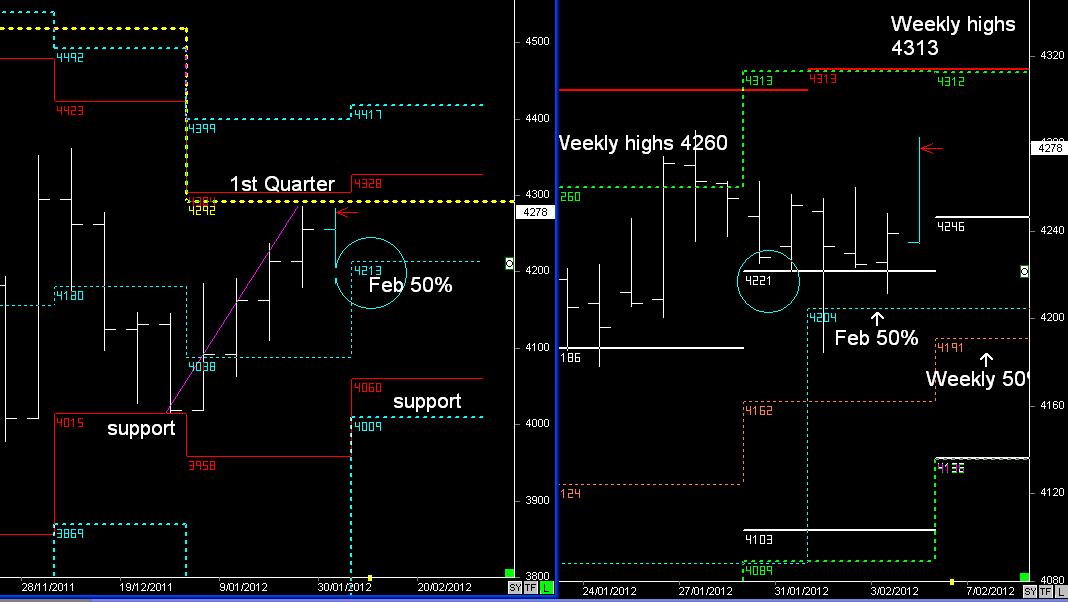
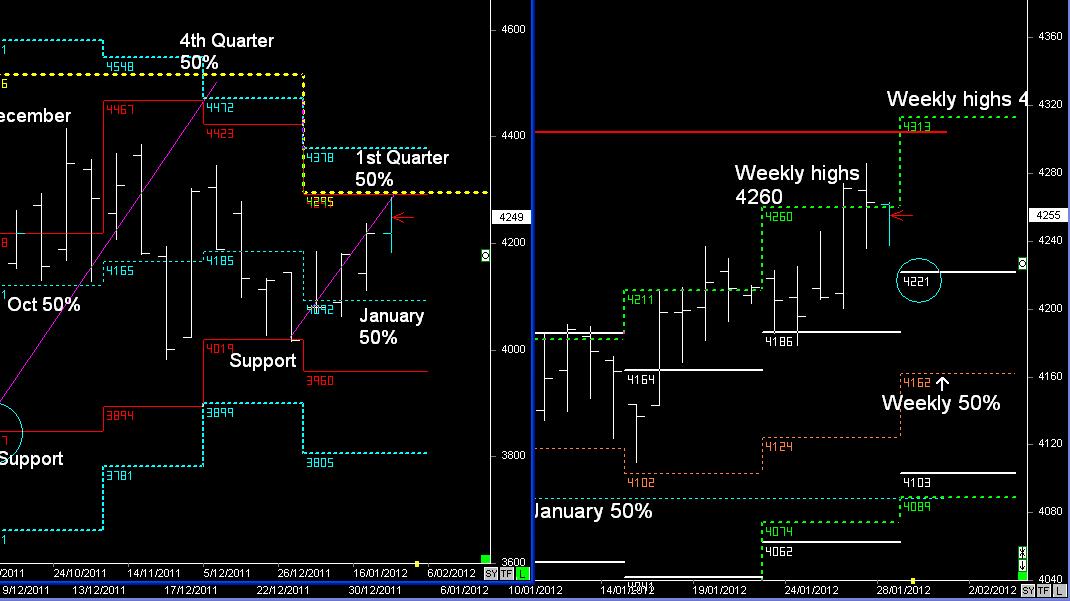
SPI Monthly cycles
As noted 2 weeks ago (Weekly Report), if the November 50% levels can't hold because of the
price action in US markets, then the Aussie Market is heading down into 4341.
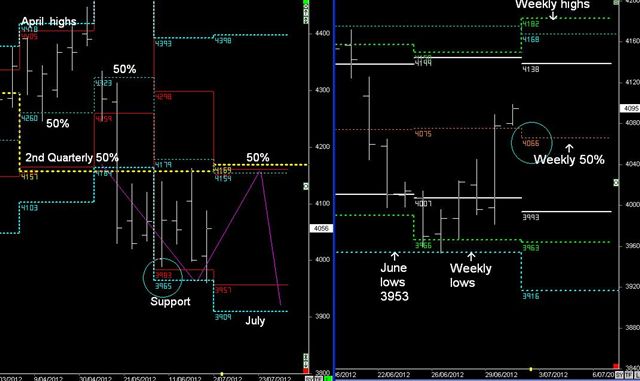
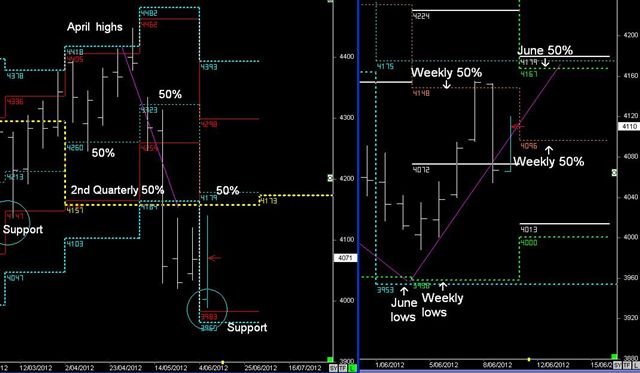
When we look back over the past number of Quarters, we can see that the SUPPORT in
each 3-month cycle coincides with this same level (RED)...
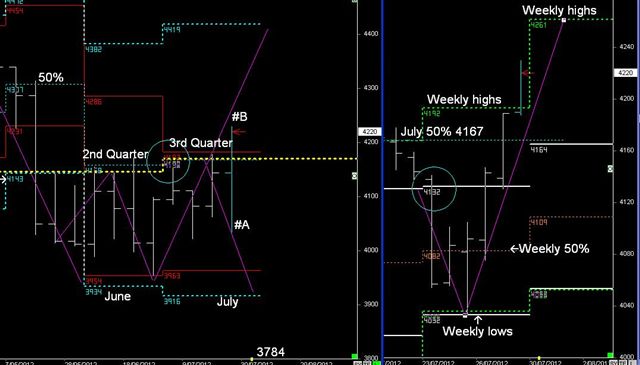
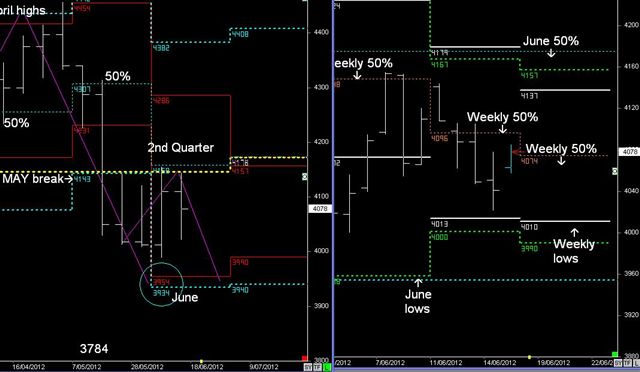
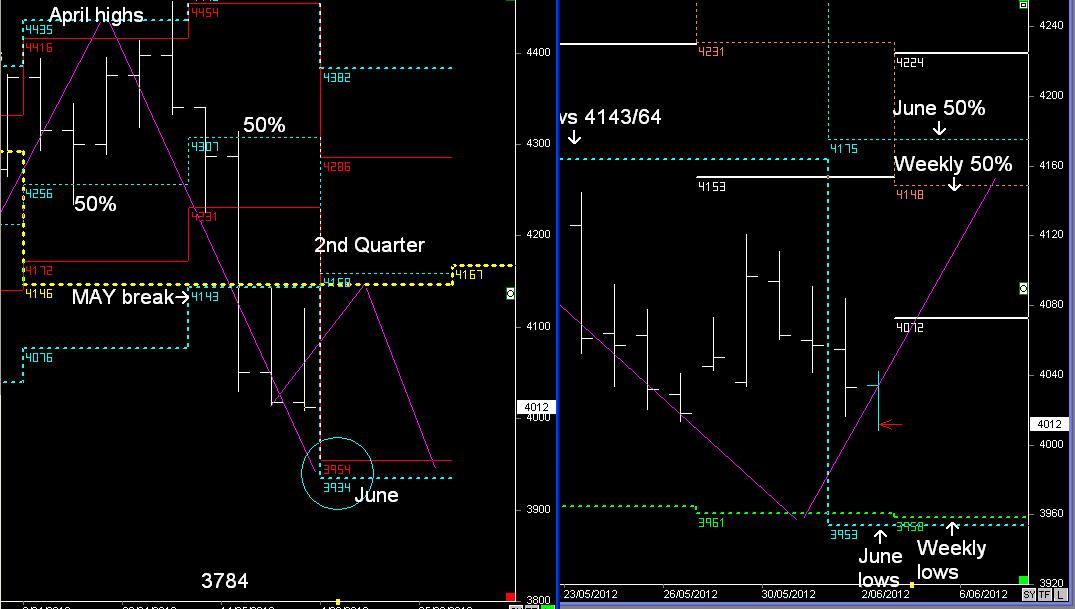
The only time it didn't was back in MAY this year, 6 months ago, but it did support it for 5-days, &
then followed a break-n-extend pattern into the following Quarterly lows.
Therefore 4341 is seen as SUPPORT during this Quarterly cycle, otherwise it will follow a similar
break-n-extend pattern into the 1st Quarter of 2013
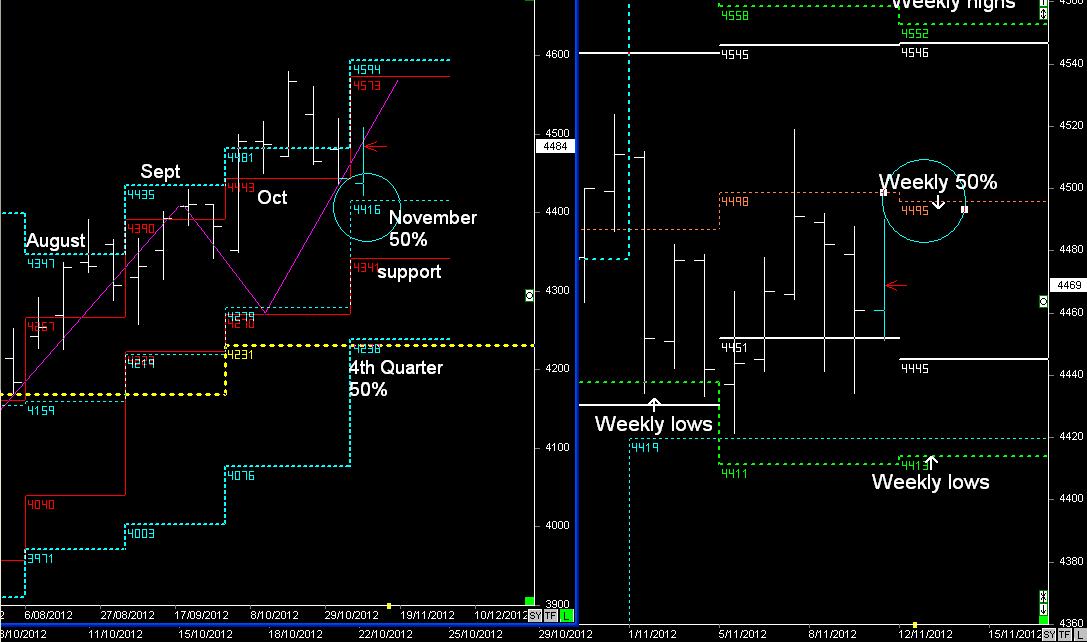
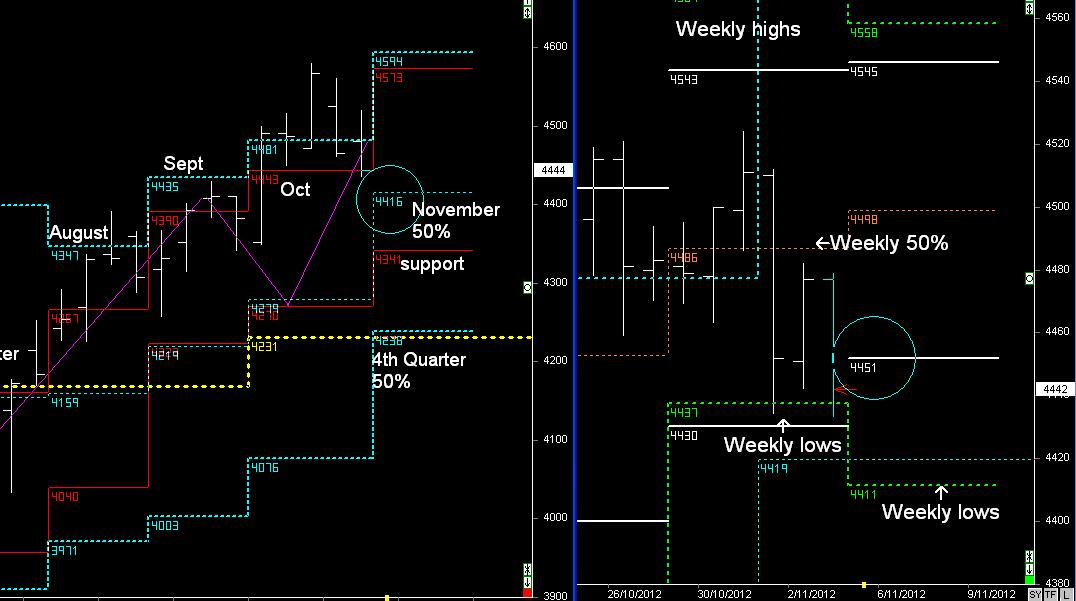
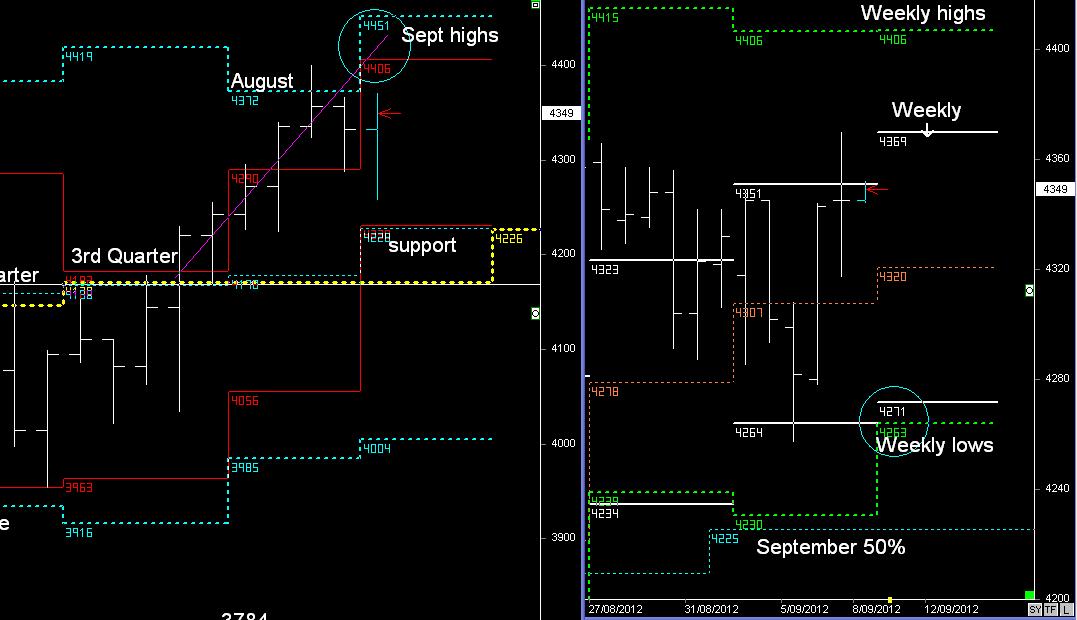
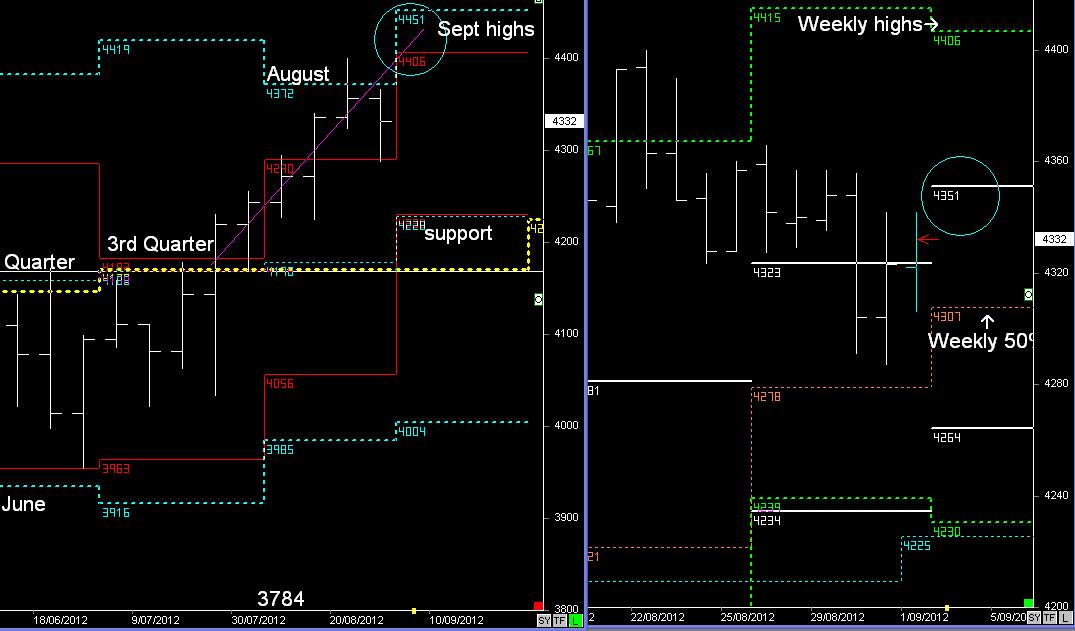
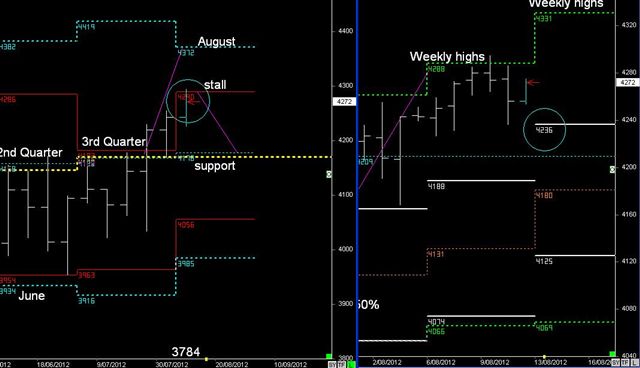
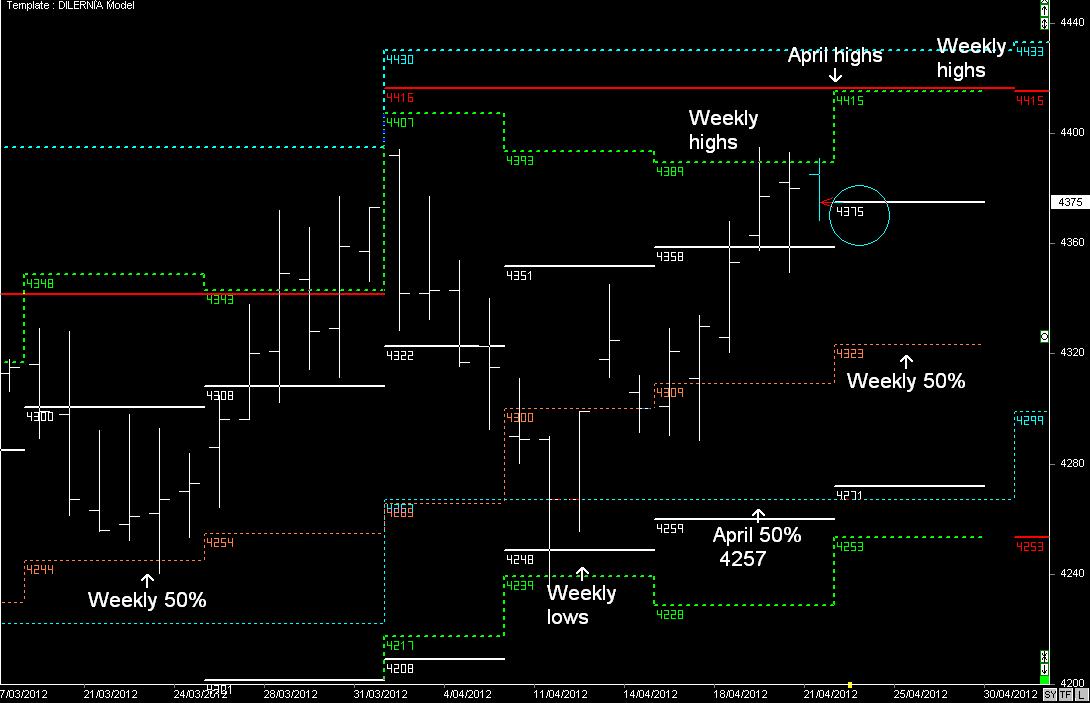
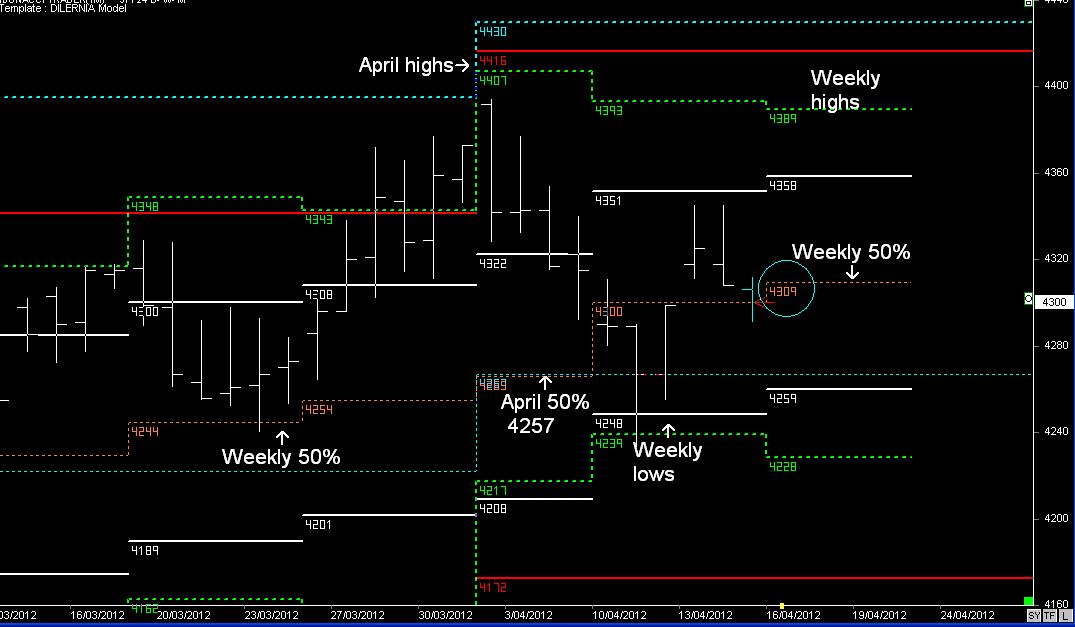
SPI Monthly & Weekly cycles
If it does rise upwards next week then it's likely to stall around the October 50% level @ 4416/19, for the next 5-days.
The critical pattern in the Weekly cycles is whether it follows the breakout of the Weekly lows @ 4413 down into next week lows @ 4301