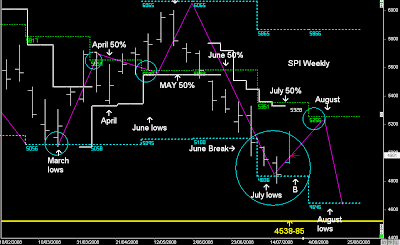
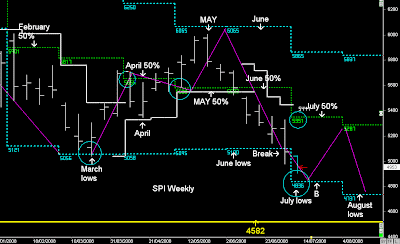
Australian( SPI)Index Weekly 26th July 08

"I'm not expecting a major counter-trend move UP like what occurred in March this Year, my view is support forming around 4836 and remaining range bound below 5100 until the end of July, and if there is going to be a 'pop' upwards into the monthly 50% level, then there is more of a chance that higher prices would occur from August.

After a rotation into the Monthly 50% level, my view remains that the Aussie market is heading down into the Yearly lows @ 4538.
"

Weekly Report 12th July 2008

SPI Weekly Report

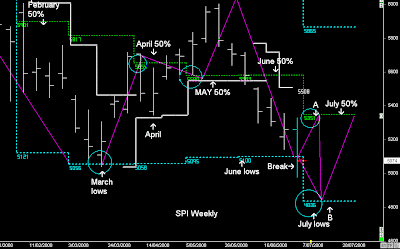
Market reversal off July's lows and a move back UP into 5100.

The reason I'm not expecting a major reversal this time compared to March is because of the breakout of June's lows. (5100)

This pattern will probably remain range bound for the rest of July and then the next move begins from August....
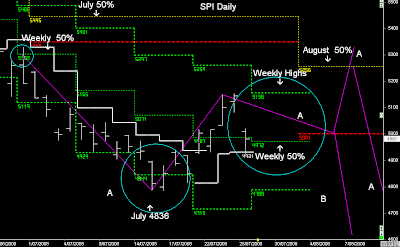
SPI Daily...

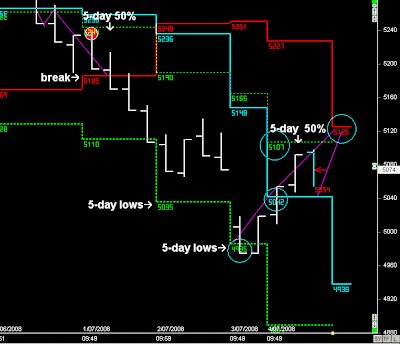
Last Week global markets reversed down from their highs, but this reversal pattern was just a rotation back down into the Weekly 50% level.

There is a big difference between a reversal down this week and previous weeks, it's occurring above the weekly 50% levels and not below.

Therefore next Week can continue higher:- lower Weekly open and rising higher after it's verified the 3-day cycle support on Friday.


"remaining range bound below 5100 until the end of July, and if there is going to be a 'pop' upwards into the monthly 50% level, then there is more of a chance that higher prices would occur from August."

So what's the POP?

The POP is the start of August defined by it's own level (balance point red dotted line).

If the market is going to rise higher and back towards the Monthly 50% level, then it's going to align with the start of August (SET=UP A)

If SET-UP A plays out then I'm looking for a move back down into the Yearly lows, but it might take a few weeks to unwind into a new down-trend.

SET-UP B:- is simply the down-trend continuing from August, which normally occurs with the market opening below the August balance point and rejects down.
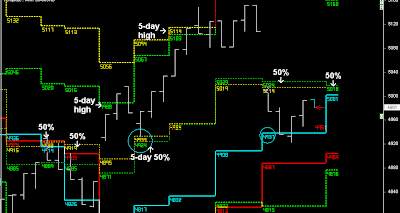

SPI 5-day pattern

Day traders simply trade on the side of the 5-day level, using the 5-day filters along with the Spiral point trading set-ups intra-day.


  • Daily Trading Set-ups & Analysis
  • Index Futures SPI, DOW S&P, & Forex
  • Subscribe to the Trader Premium
  • http://www.datafeeds.com.au/premiumtrader.html


  • Australian( SPI) Index Weekly 19th July 08

    "Once the July lows (4836) are reached next week, my expectation is price is going to swing back towards the 3-week highs.

    A rotation UP towards the Monthly 50% level, but it could take a number of weeks to move back towards the Monthly 50% level in August."


    Previous Weekly Report


    SPI Weekly and Daily charts

    The Australian Index found support around July's lows @ 4836 , but the reversal upwards last week wasn't as robust as US markets, namely because BHP was dragging the market down.

    I mentioned a number of weeks ago that BHP and other resources stocks would be the main culprits in sending the Index lower, whilst telling my readers that once 4836 hits that i'll be moving back into financials for the 3rd time this year.

    And i'll be exiting banking stocks around their Weekly highs and moving into cash again probably early next week.

    I'm looking for the Aussie index to remain range bound between last week's lows and 5100, and could move slightly higher in August and back into the 50% level.

    After any completion into the 50% level, my view remains for prices to move back down into lower lows in coming months.

    • Daily Trading Set-ups & Analysis
  • Index Futures SPI, DOW S&P, & Forex
  • Subscribe to the Trader Premium
  • http://www.datafeeds.com.au/premiumtrader.html


  • Australian( SPI) Index Weekly 12th July 2008

    "Whenever there is a breakout of the Weekly timeframe and Friday closes below (5100), price normally continues down towards the next weekly lows after a 2 day consolidation.

    Breakout of June's lows @ 5100, can send the market down into 4836 before any reversal pattern back towards July's 50% level occurs.

    Therefore the first two days of trading next week should give traders a fair idea on how the market is going to play out, because if the trend is going to continue down, it will normally occur after a 2-day 'stalling' pattern."


    Previously Weekly Report

    SPI Weekly chart

    SPI has continued down from 5100 and the breakout towards 4836.

    Once the July lows are reached next week, my expectation is price is going to swing back towards the 3-week highs, but that needs to be confirmed with similar price action in the US markets.

    http://www.usindexweekly.blogspot.com/

    SPI Daily

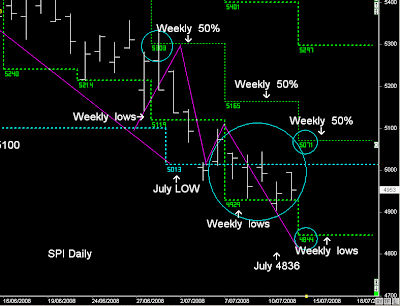
    Last Week the SPI remained in a tight 5-day pattern around the Weekly lows 4929, and next Week's lows @ 4844 match my overall view of the down move into 4836 in July.

    Note: A rotation UP towards the Monthly 50% level, but it could take a number of weeks to move back towards the Monthly 50% level in August.

    What that basically means is that, I'm not expecting a major counter-trend move UP like what occurred in March this Year, my view is support forming around 4836 and remaining range bound below 5100 until the end of July, and if there is going to be a 'pop' upwards into the monthly 50% level, then there is more of a chance that higher prices would occur from August.

    After a rotation into the Monthly 50% level, my view remains that the Aussie market is heading down into the Yearly lows @ 4538-82, which will be helped by Resource stocks namely BHP.

    Any UP move in the next few weeks is only viewed as short-term, with the expectation of lower prices in 2008.

    • Daily Trading Set-ups & Analysis
  • Index Futures SPI, DOW S&P, & Forex
  • Subscribe to the Trader Premium
  • http://www.datafeeds.com.au/premiumtrader.html


  • Australian( SPI) Index Weekly 5th July 2008

    “Note:- Around the 100% of the Weekly lows in the 24 hour market has often provide major support and reversal patterns in the market for the current weekly timeframe.

    That area of interest is around 4953”…… Thursday’s Report


    SPI Daily

    SPI reversed down from the Weekly 50% level and completed the move into July's lows, hitting a low on Friday in sycom @ 4951, and we can see Friday moving higher from 5013.

    Around July's low after completing a 2 month wave pattern downwards, I'm look for a counter-trend move back towards the July 50% level.

    A few of things need to be verified for the UP move to occur :- bounce off Monthly lows, breakout of the 5-day highs (usually lead by US markets), and then price needs to be trading above the Weekly 50% level.

    So far the first pattern is playing out, and now we need to see two more.....

    But is the SPI going to move higher, or actually continue down???

    Whenever there is a breakout of the Weekly timeframe and Friday closes below, price normally continues down towards the next weekly lows (4929) after a 2 day consolidation.

    We can see this pattern taking place, as was the case two weeks ago.....

    SPI Weekly

    In the Weekly chart the same pattern, breakout of June's lows @ 5100, can send the market down into 4836 before any reversal pattern back towards July's 50% level occurs.

    Therefore the first two days of trading next week should give traders a fair idea on how the market is going to play out, because if the trend is going to continue down, it will normally occur after a 2-day 'stalling pattern.

    There are two set-ups in Play in July:-

    Set-up A:- bounce off July's lows @ 5013 and continue up into the 50% level.

    or

    Set-up B:- continuation downwards, which is still a possibility, because of the breakout patterns just discussed.


    SPI 5-day

    All intra-day 5-day pattern trading, set-ups, and filters discussed in the 'Trader Premium'


    • Daily Trading Set-ups & Analysis
  • Index Futures SPI, DOW S&P, & Forex
  • Subscribe to the Trader Premium
  • http://www.datafeeds.com.au/premiumtrader.html


  •