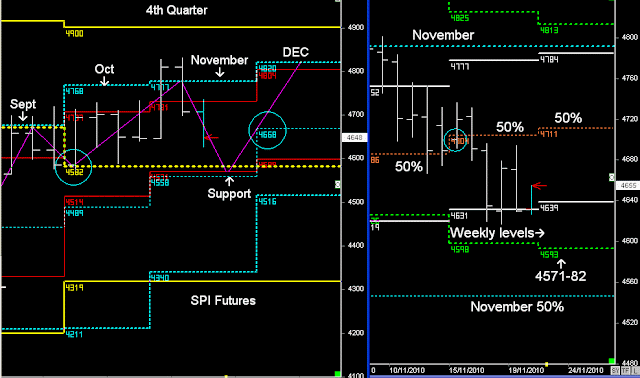
Aus"The Trend bias is to continue down into support levels @ 4571-82.
If the market is going to go higher then these levels need to be verified by next week's close and then continue higher. This usually occurs in the last week of the current month and then pushes upwards in the first week of December from the new December Monthly 50% levels.
What we also notice is that December has a higher step formation @ 4668
Previous Weekly Report
SPI Futures
The market has moved down into the Support levels and have held for the past 4 days.
As mentioned a couple of weeks ago, once support has held the up trend begins to take hold in the last week of the current month (next week) and continues towards higher highs in the first Quarter of 2011.
However, there are two patterns that can change that view...
#1 the higher step formation in the forward month can result in a change in trend identification
#2 there's currently a Dilernia Drop in the S&P, which can continue to put short-term pressure on US markets until the end of the month (Read US Report)
Aussie Index (SPI) 20th November 2010 Weekly
SPI monthly and Weekly
This quarter has seen the market follow a double monthly high pattern into November's highs and a reversal down, which is often the case as the market comes back looking for support.
The Trend bias is to continue down into support levels once again @ 4571-82.
If the market is going to go higher then these levels need to be verified by next week's close and then continue higher in December.
This usually occurs in the last week of the current month and then pushes upwards in the first week of December from the new December Monthly 50% levels into a higher weekly close.
What we also notice is that December has a higher step formation @ 4668
This can often end up a bearish pattern (please read current book regarding forward bearish patterns)

SPI Primary Cycle
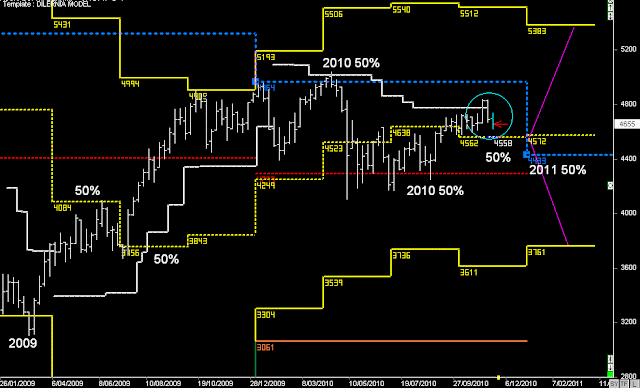
We can see the market consolidating between the two Primary cycle 50% levels in 2010.
These levels will shift in 2011, with resistance disappearing @ 4964 and a potential upward trend towards 5383.
Major support levels in 2011 will be around 4433
Current Price action in the 4th Quarter has been trading above the 4th Quarter 50% level (Yellow), and recently there has been a change in the 3-period cycle (white), which now becomes support and a trend guide for the rest of this year and going into 2011
This gives more reason of the trend moving upwards over the next couple of weeks, as described in the previous chart
However, I also mentioned a potential bearish pattern appearing in December:- higher step formation.
If it does appear in the 2nd week of December, then the rotation pattern is for the market to move down towards the 2011 50% level @ 4433
Posted by
Frank Dilernia
Aussie Index (SPI) 13th November 2010 Weekly
In the short-term, the market is either going to continue to push up towards next week's highs @ 4876 and then 4900
Or ...
we look for a minor corrective move back to retest the breakout & 4724-52
Previous Weekly report
Australian Market (Index futures SPI)
Last week began with price trading above the November highs and with the target @ 4900 in the 4th Quarter:- resistance
However, when Tuesday opened below the November highs @ 4791 then the trend changed with a short-term reversal pattern down into 4752
And once 4752 couldn't hold, the trend bias was to move from a higher weekly open and continue to reverse down from the November highs into a lower Weekly close.
At this stage the market looks to be once again moving into a consolidation pattern within the weekly levels.
And higher timeframe support @ 4582
Posted by
Frank Dilernia
Aussie Index (SPI) 6th November 2010 Weekly
SPI Futures
Market continues towards the 4th Quarter target @ 4900
Helped by the S&P 500 moving higher on the news that the Fed is about to print $600 Billion to stimulate the economy.
In the short-term, the market is either going to continue to push up towards next week's highs @ 4876 and then 4900
Or
we look for a minor corrective move back to retest the breakout & 4724-52
Note:- 4900 is the target for this Quarter.
This level may resist the trend for a number of weeks, or it may not (December)
What that means is, the 'THRUST PATTERN' from the Secondary cycle @ 4582 can last 2 quarters and continue into higher highs by 2011.
If we follow the primary cycle, that can be as high as 5200.
for the market to move towards 5200, banking stocks need to find support in November and then begin a gradual rise from the start of December.
Posted by
Frank Dilernia
Subscribe to:
Posts (Atom)


