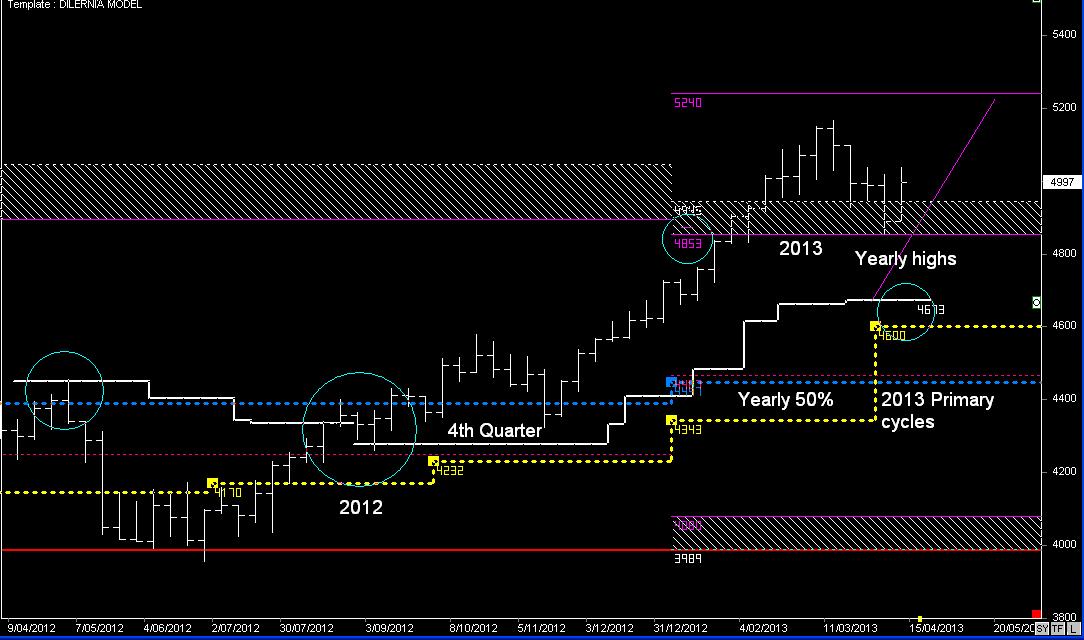
SPI Primary & Monthly cycles
Primary Cycle suggests the trend will continue to move up towards the 2014 cycles highs (Read US S&P 500 report)
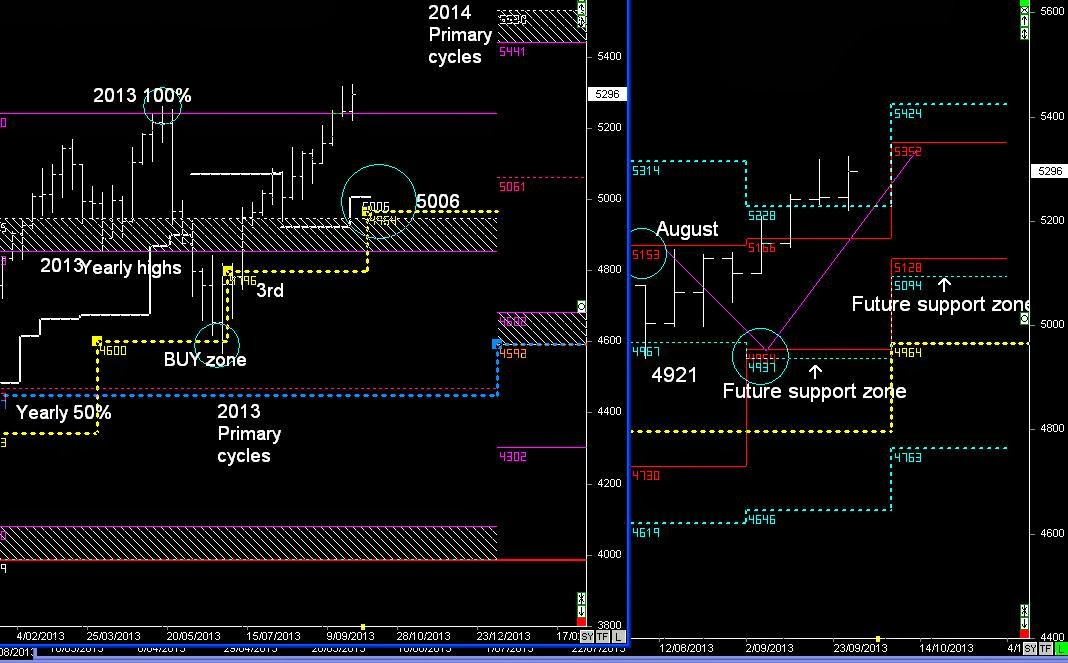
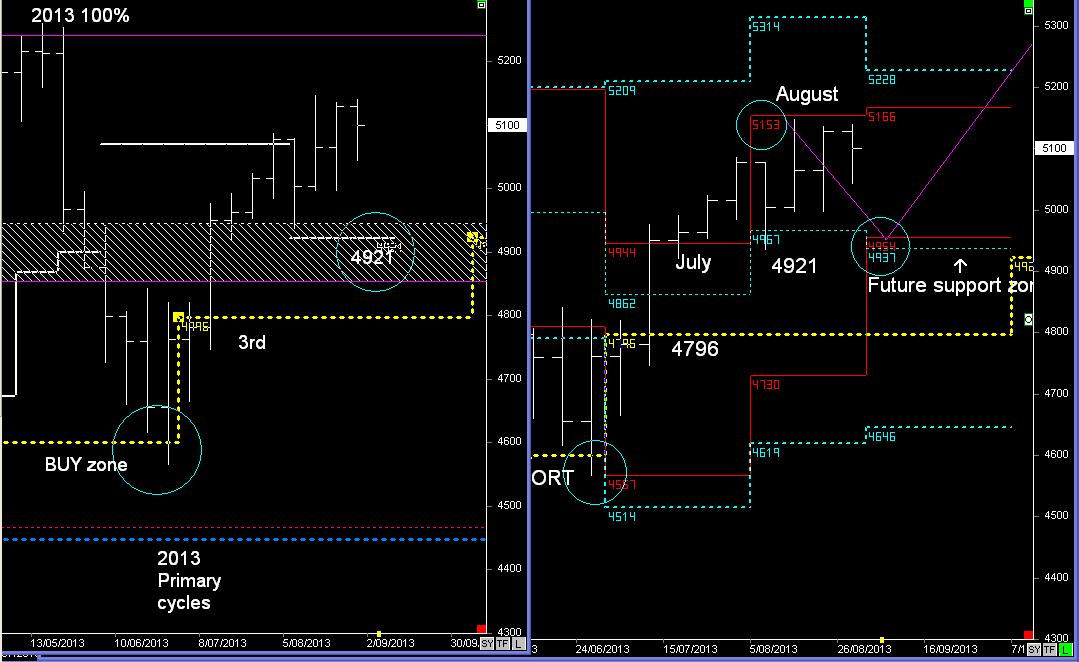
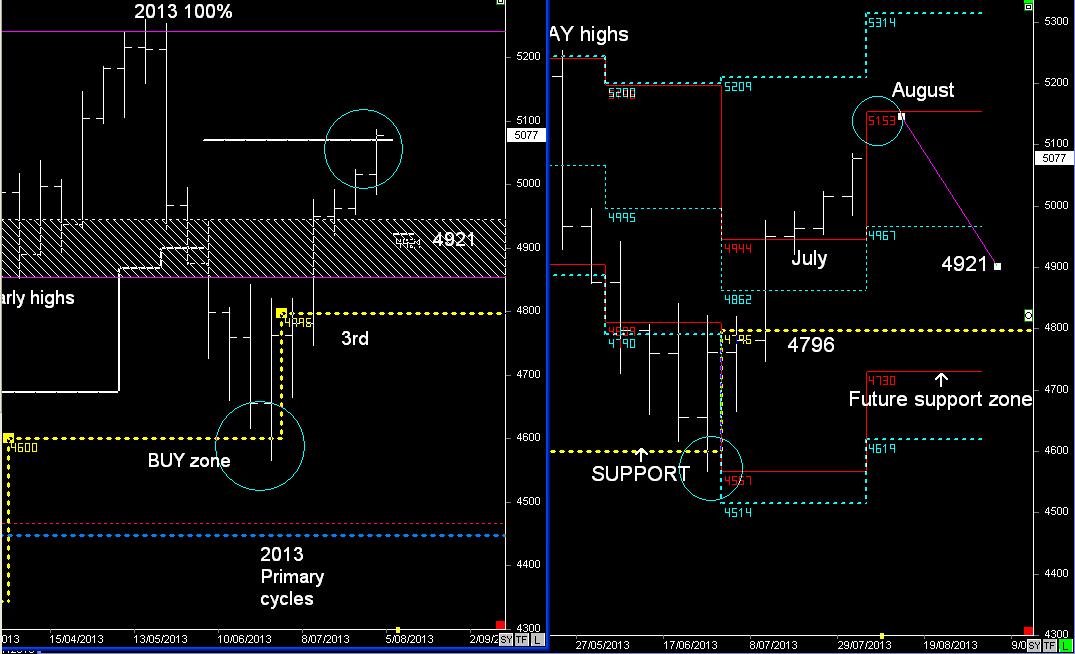
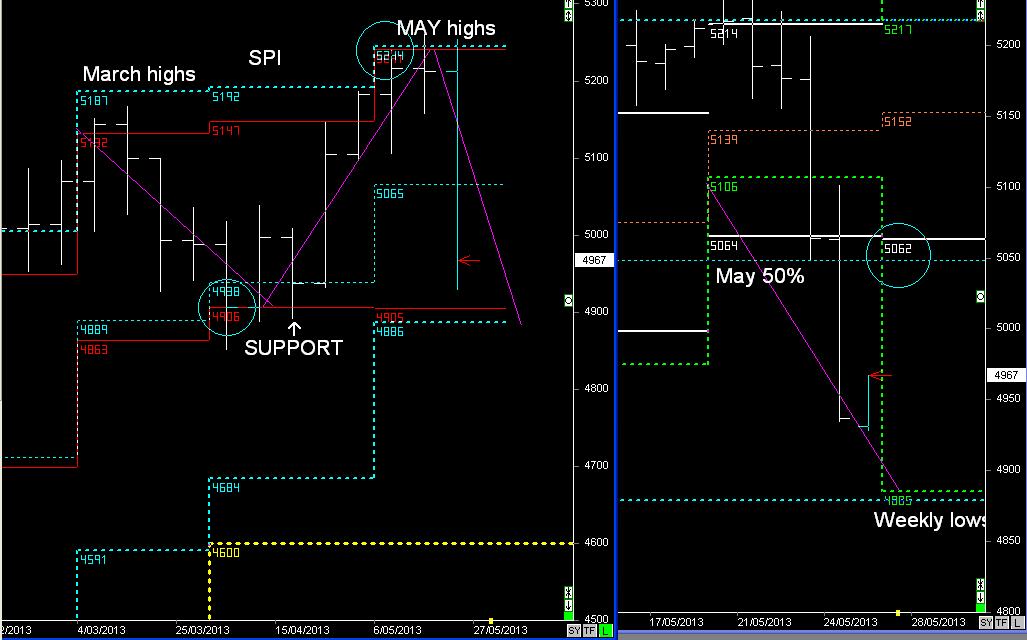
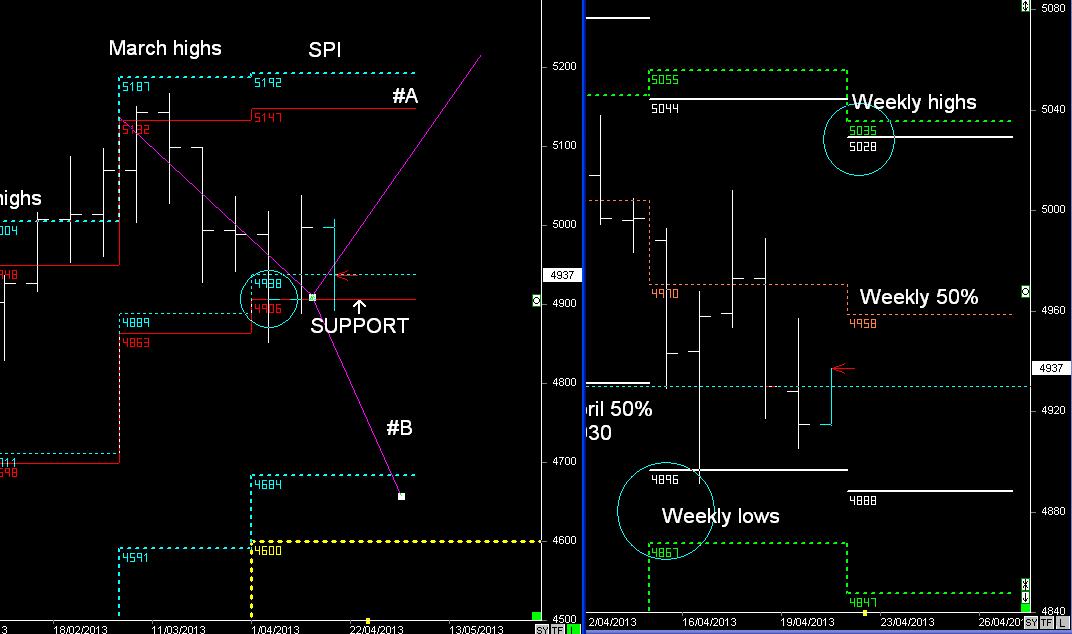
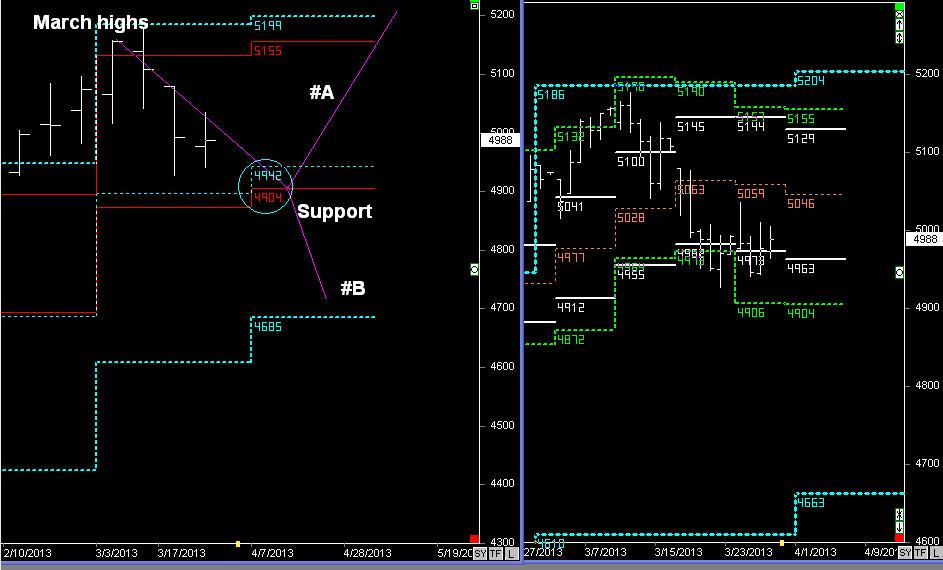
BUY zone in the 4th Quarter @ 4960, didn't reach, but the BUY zone in the first quarter remains @ 5066 if there is any short-term resistance.
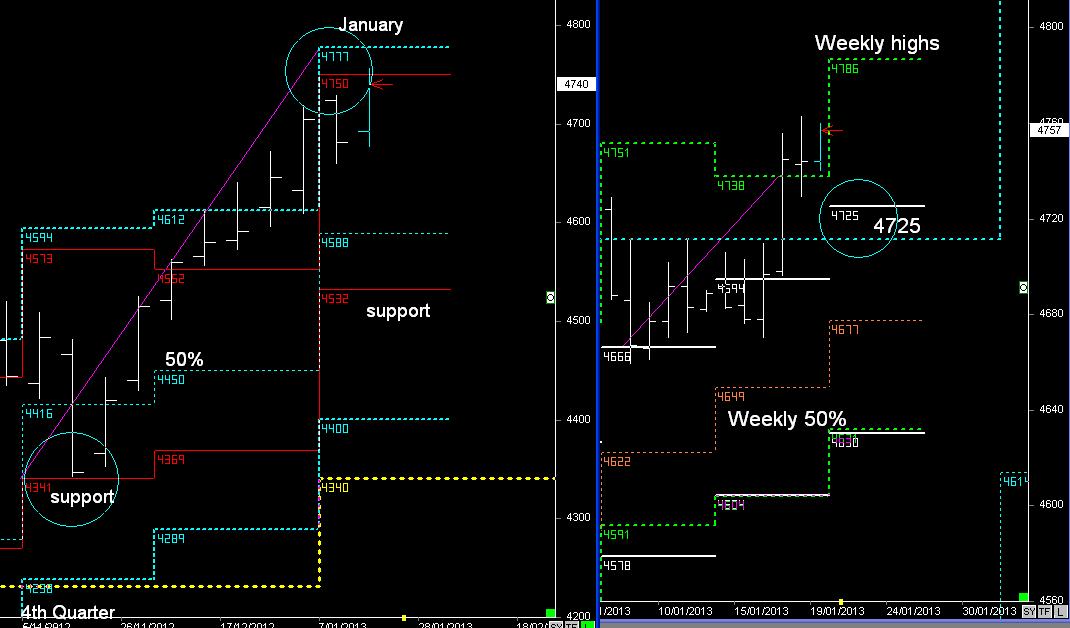
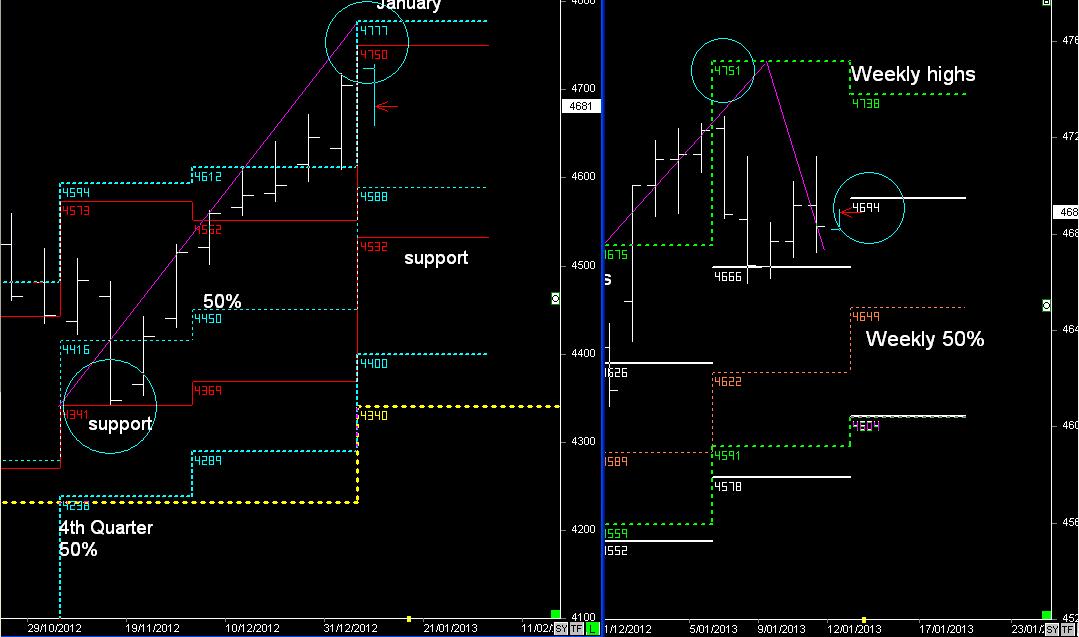
Note:- there is a breakout in December (December 50% level matched with red channel),
this can act as resistance (along with 5338) for the rest of December.
A close above 5338 by the 31st of December, as occurred at the end of July, will help validate that Primary Cycle