Aussie Index (SPI) 29th August Weekly

SPI Futures

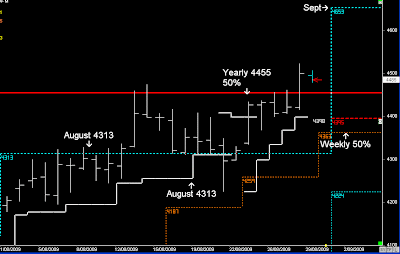
Expectation that a move towards 4455 would play out in the 3rd Quarter from the July Thrust pattern and then reverse down into the 50% levels before the next leg upwards.

Or that is what I hope for.

The reversal down was based on price retesting the July breakout and matched with the 50% levels and then heading higher into the end of quarter.

The 2nd week top @ 4455 and 3rd Week reversal should have continued down in the 4th Week, and not have a lower Weekly open above 4314:- rising and higher Weekly close.

4314 was the August highs, and price will most likely follow the September pattern towards 4664, as the monthly timeframe will close above the August highs.

SPI Daily

Trend support next Week is 4367-95, with a bias to move higher.

Note:- levels will be confirmed after another Week of trading (5-days)

As the Weekly timeframe won't move into September until next Friday's close.

Aussie Index (SPI) 22nd August Weekly


SPI Futures

As per previous report, once the Yearly 50% level was reached my view was that the Australian market would pullback.

The confirming pattern was Friday's break of support and change of cycle, but unless price is trading below the Weekly 50% level, the Australian Market can consolidate around these highs.

Any further weakness in the Australian market will be dependant on US markets, as the S&P will reach the same level next week :- Yearly 50% level 1038.

The previous Weekly report has my view on the market in much more detail.

Aussie Index (SPI) 15th August Weekly

SPI Futures

SPI Completes the 3rd Quarter move into the Yearly 50% level @ 4455.

That was my entire 3rd Quarter UP move play, which occurred much quicker than I wanted it to.

My preferred play was the reversal down from August highs @ 4313 and trade longs once again off Monthly support into these highs based on another 2 month higher high pattern.

This now completes the 3rd quarter move, and I won’t have a view until this month ends or even the next quarter begins.

Exact same pattern in 2003 stalled at this precise level and reversed down into trailing support levels and then continued higher in the following Quarter.

If it follows the same pattern, then the next UP move into the market is more likely to align with the start of the 4th Quarter.

Financial Index

As pointed out a while ago, the UP trend in the market were going to be lead by financial Stocks.

3rd Quarter 'thrust' pattern into Yearly 50% level has completed.

Any further UP moves would need to align with the 4th Quarter 50% level.

Set-up A:- continues up from the 4th quarter 50% level and into the highs, which aligns with the Yearly 2010 highs.

If that happens then price can push back down into the Yearly 50% level in 2010 and consolidates for a number of Quarters during next year and move into a long term sideway pattern until the 2nd half of 2010.

However, for me to BUY into banks right now, I would actually need to see the Index come all the way back down into the 50% level in this Quarter and where the 'Thrust' pattern began. (Set-up B)

Set-up B:- finds support, which could then lead to Set-up A occurring, or it might even struggle for the rest of the 4th Quarter if it can’t get back above the 4th Quarter 50% level.

If that happens then price action is going to be dependant on the 4th Quarter 50% level, because price might end up moving sideways until the end of the year and 2010 begins.

If that's the case, then next trend will then be based on the Yearly 50% level for 2010.

Set-up C:- continues up from the Yearly 2010 50% level and back towards the 2010 highs, but could remain range bound between the highs and 50% level over a number of Quarters until the 2nd half of 2010.

Set-up D set-up

Opens near the 2010 Yearly 50% level and sells down quickly over a number of months into the lows once again, and then swings back above the Yearly 50% level in 2010 in the 2nd half of the year.

If that happens then banks will continue higher over the next 2-3 years into a long term UP trend

Basically, the 4th quarter 50% level is going to set-up my the next BUY strategy and i'll wait until then, or unless SET-UP B plays out.

Aussie Index (SPI) 8th August Weekly

SPI Monthly and Weekly

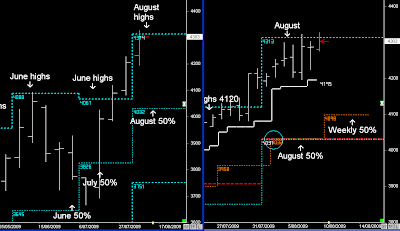
July high breakout and expectation price would continue with the break and extend into the new monthly highs in August:- Dilernia Principle.

The SPI wouldn't sell off this week once it hit the highs, but there could have been a reason because US markets (DOW S&P) had to complete their August highs, which they did on Friday.

I'm now looking for a reversal pattern from next week's higher open back down towards the July breakout, with the first target the Weekly 50% level.

I'm still bullish in the market, but I would like to see market pullback over a few weeks to retest the breakout and verify it's valid.

If the breakout is valid, then the SPI should push up into new highs later in the 3rd Quarter & early 4th Quarter.

The first sign of the reversal will be price trading below the 5-day 50% level, but won't be confirmed until there is a 5-day low breakout of the range.

However, I'm not expecting the SPI to drop like a 'thud', I’m expecting the markets to zig-zag their way back down, mainly within 5-day pattern rotations.

Based on monthly high resistance levels which are valid and are very reliable, along with a higher Weekly open, the only conclusion I can come up with is a reversal down before it goes up later in the 3rd Quarter.

Don't short trade above 4313 next week....

Later this month and a number of stocks are reporting which can easily push the market higher and complete the move into 4400+ earlier than I hope for.