Aussie Index (SPI) 28th FEB 2009 Weekly

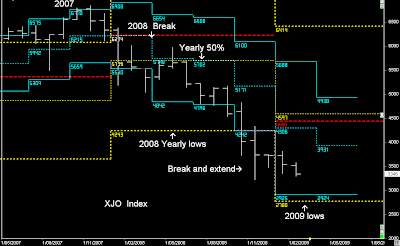
Australian XJO Index Yearly and Quarterly Model

2008 Yearly breakout @ 4243.

Dilernia Principle:- Breakout of the timeframe and price moves to the extreme of the next timeframe


The Australian Market should reach the Yearly lows@ 2780 by the 2nd Quarter of 2009.


But these won't be the lows for the Year, as there will be a lesser timeframe that extends slightly lower pushing the market below 2780.

I'll will know when the lows are by a monthly breakout pattern that will extend downward, which was the exact same pattern in 2003

SPI Futures Monthly


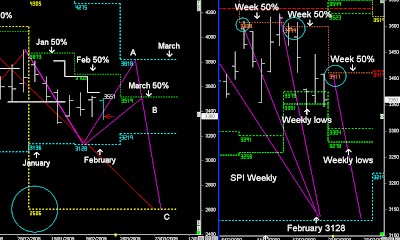
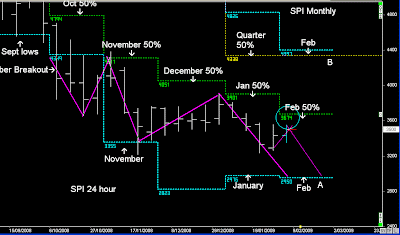
The SPI should continue down into the Monthly lows in March, and then continue to follow the same pattern down towards 2780 in the 2nd Quarter, as the April lows extend downward.

That would be based on text book patterns as price follows the waves of Time.


SPI Weekly

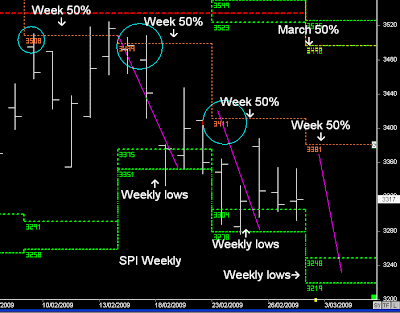
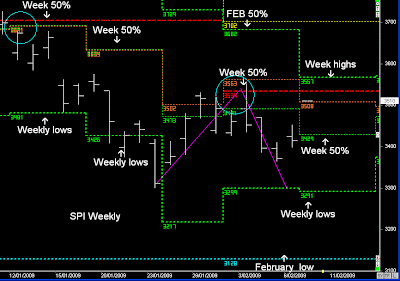
As has been the case in February, the downward movements have followed the lesser Weekly timeframe lower.

But as each Weekly low has been reached, the market consolidates.

In conclusion:- the Australian Market is heading down into 2780 & lower

How it gets there is by either a swift move down in March, or price can follow the timeframe patterns downward which can take a number of weeks to play out, as each new support level shifts as time moves forward.


  • Daily Trading Set-ups & Analysis
  • Index Futures SPI, DOW S&P, & Forex
  • Subscribe to the Trader Premium
  • http://www.datafeeds.com.au/premiumtrader.html


  • Aussie Index (SPI) 21st FEB 2009 Weekly

    SPI Monthly (24 hour markets)

    Expectation the SPI is heading down into the February lows, but it has been lagging the price action in February compared to the DOW Jones and other US markets.

    http://usindexweekly.blogspot.com/2009/02/dow-s-weekly-21st-february-2009.html

    The expectation is for the SPI to move down into 3128-2950 and then look for a bounce upwards.

    Any Bounce upwards will only be short-lived, as there is an expectation that the Australian Market is heading much further down in 2009

    So what is going to turn the market around in the Short-term?

    It has to be Financial and banking stocks!

    The Financial Index is coming down into a major support level in the first Quarter @ 2900.

    This has the potential to bounce the banks and move them upwards taking the market higher.

    Note:- 2900 is not my low target for the year on Financials, it is around 2500.

    Therefore any bounce off 2900 and targets are the 3-week highs exit, as there is a view over lower prices towards 2500 in the Fin Index.

    If February closes below 2900 in the Fin Index, the Aussie market will be on it's way down towards 2600


    SPI Monthly and Weekly (Day Session)

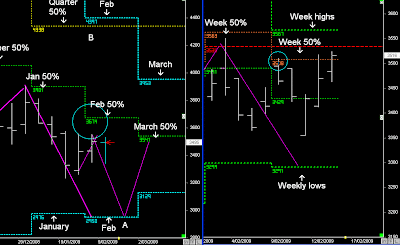
    I expected more weakness this month down into 3128, but instead February continues to be range bound and resisted around the Weekly 50% level.

    Next Week's view is that 3411 will be the next resistance zone, trying to push the market lower once again.

    The interesting part in the SPI compared to the US markets is, there hasn't been a breakout below the 5-day dynamic lows to confirm more weakness. The SPI continues to swing around within the 5-day range, which is ideal for short-term Spiral point trading

    In conclusion


    I mentioned at the start of February that a move down into the February lows in the first 2 weeks of the month has the potential to reverse upwards 25-30%.

    We still haven't reached those lows yet.

    We have three scenarios….

    SET-UP A:- reversal off the February lows next week back into the March 50% level and then continues the down, as it follows the Primary cycles into lower levels.

    This is lead be a break of the Financial Index below 2900 and monthly close below

    SET-UP B:- for any 25-30% reversal upwards to occur, the last week needs to bounce lead by Financials along with US markets following the same pattern:- double Monthly lows.

    If that occurs then there is the view of a slight push higher in March to complete the remaining percentage move.

    Set-up B is a retest of the 3-month highs in March-April and then the market continues down into lower lows in the 2nd Quarter.

    Maximum move is towards the March-April highs


    SET-UP C:- fails to hold February’s lows and continues down in another breakout pattern, similar to October in 2008.

    Lead by Financial Stocks breaking below 2900 and heading down towards 2500.

    Regardless of any bounce off these support levels in February, or even if Set-up B occurs, The Australian Market has to go lower to complete the Primary trends of 2009.


    • Daily Trading Set-ups & Analysis
  • Index Futures SPI, DOW S&P, & Forex
  • Subscribe to the Trader Premium
  • http://www.datafeeds.com.au/premiumtrader.html


  • Aussie Index (SPI) 14th FEB 2009 Weekly


    SPI Monthly and Weekly

    I'm still bearish on the Index and I'm still expecting lower prices in February.

    Only if Price can move down into the February lows @ 2950-3128 to complete a double Monthly low pattern would I then feel the market is ripe for a bounce.

    If the Market remains range bound for the rest of February, as it has done for the past 3 weeks then the March 50% level will define the trend.


    SPI Weekly and 5-day pattern

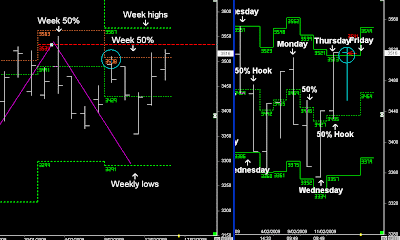
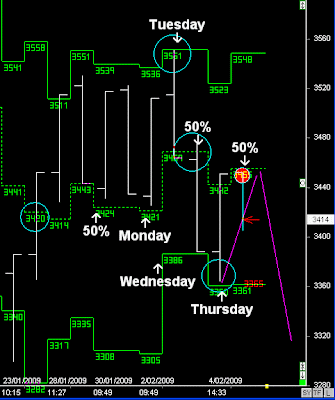
    Last week the SPI had a higher Weekly open pushing down from the 50% level @ 3508.

    Tuesday broke the 5-day 50% level @ 3469 and continued down into Wednesday's lows.

    As has been the case lately, the Market remained range bound between the 5-day channels and consolidated.

    Once above the 5-day 50% level, the market continued higher and stalled.

    Therefore if the market is going lower, then early next week we need to see the SPI continue down from Thursday-Friday's highs and break the 5-day 50% level once again.

    I'm not bullish on the market, and i'd keep my eye on Resource stocks next week for any signs of prices reversing down, as this will drag our market lower.

    If BHP starts trading below Friday's lows and remains below Friday's lows, then resource stocks can begin to drift back do into January's recent lows.


    Aussie Index (SPI) 7th FEB 2009 Weekly

    "I was only looking for a 1 week UP move before the trend continues downwards at the start of February.

    Basically the Weekly 50% levels will define the trend next week, and which direction the market will take.

    I would like to see the SPI and other global markets continue down into February's lows in the first 2 weeks of the month.

    Why?


    Because if that can occur it will complete a 2-month pattern in the first Quarter.

    I would like to see a drive down into February's lows in the first two weeks, find support and then we could probably get a 25-30% bounce off the lows"


    Previous Weekly Report

    SPI Weekly

    As per Weekly Previous report..... We saw the SPI move up early and then reverse back down.

    I was looking for another push down next week on the SPI towards the Monthly lows, but because of the higher move in the US markets on Friday, that 2nd week drive down doesn't look like it's going to happen.

    If we had hit the February lows then I think the Australian market was in for a decent reversal upwards of around 25-30%, lead by Financials.

    But now with the SPI trading back around the Weekly highs, at this stage 3567 is view as resistance for next week.

    SPI Monthly

    A per previous Weekly report, I didn't want to see the SPI move up in the first 2 weeks of February, because it doesn't clarify the Monthly cycles.

    A Drive down and a reversal off the Monthly lows, and I would have looked for a move back towards the Monthly highs:- 25-30%.

    There can still be a move towards the Monthly highs, but I would then look to see if the Financial Index is going to follow a similar pattern:- support 2905.

    The Resource stocks are keeping the market afloat, but at this stage I can't see resource stocks doing all the work, it has to be helped mainly by banking stocks following a double Monthly low pattern and move towards the Monthly highs

    SPI 5-day pattern

    Last week the SPI followed a number of text book patterns.

    From the Rise up on Monday Tuesday towards the 5-day highs, and then the reversal back down confirmed with the break of the 5-day 50% level.

    A reversal upwards on Thursday back towards Friday's 50% level, and a push lower.

    In any normal down trend the market would remain below the 50% level, but because Monday will open higher price should be moving towards the highs again:- Weekly highs resistance.