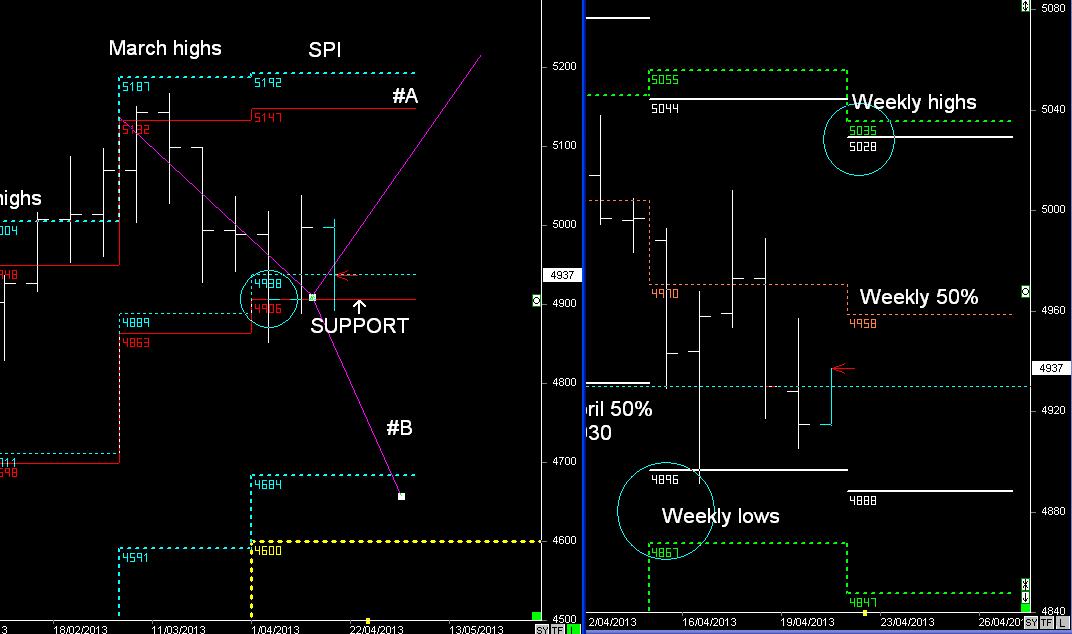
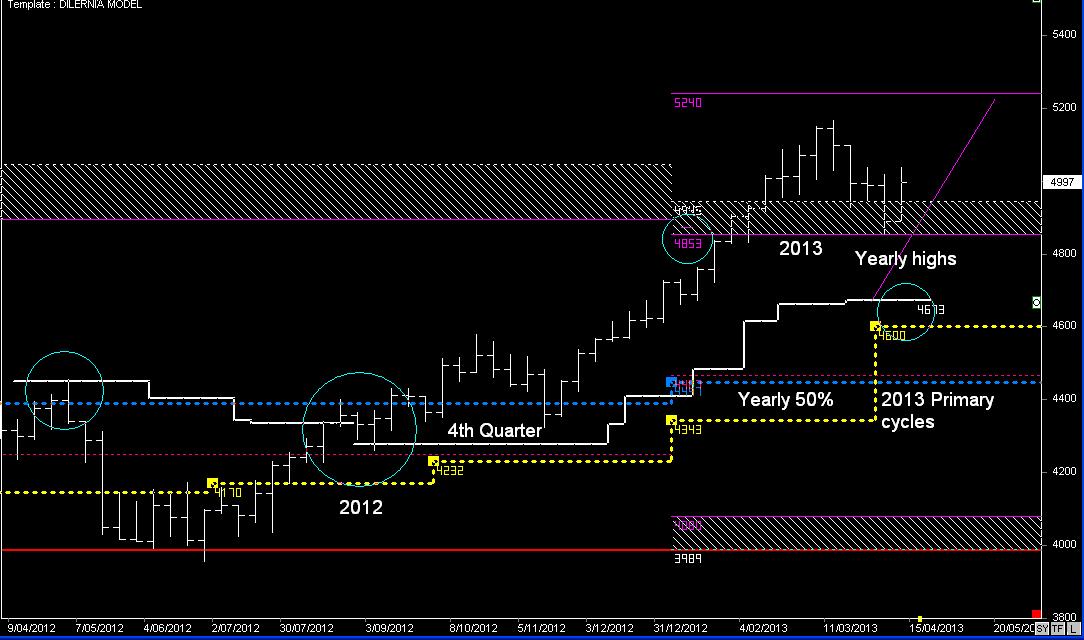
SPI Monthly & Weekly cycles
The Australian Stock Market continues to trade above the 2013 Yearly highs, and remains above April Support levels @ 4904,There is a bias to continue higher, as financial Stocks (READ the Stock Report) show the same bullish signs, however the collapse on commodity prices & Resource stocks keeps a lid on the overall market rising.
Those Commodity prices are now around 2013 primary BUY zones, which can see a short-term rise in the last week of April and into the start of MAY (Previous Report)
Trend bias is to continue higher next week, helped by the Weekly breakout and extension up into next week's highs.
if there's any weakness next week, it's based on retesting last week's breakout @ 5057 (Support)
If it does continue higher the next 5-days, and then into new highs the week after next, then it's time to look to profit taking, and then look for the same BUY zone in the 3rd Quarter.
NOTE: THIS IS THE LAST REPORT FOR A NUMBER OF WEEKS, AS I HEAD O/S.