Aussie ( SPI)Index Weekly 29th Nov 2008

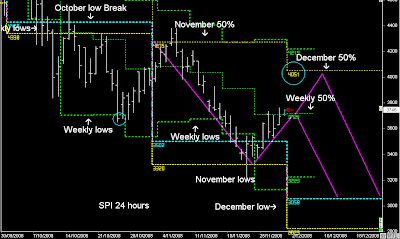
SPI 24 hour market

So far the 4th Quarter breakout pattern in the first week of October is playing out precisely.

October lows resistance, reverse back into the November 50% level and thrust downward into the November lows....

And now a rotation upwards towards the December 50% level, with the potential of further weakness next month.

SPI MONTHLY & WEEKLY


November lows support and a late rally on Friday has pushed the SPI upwards, as it looks to move towards the December 50% level next week.

Once Tuesday opened above the November lows @ 3584, helped by US markets reversing off their November lows, my view of November support and rotation back towards the December 50% level is playing out.

I also have the view that there is a double monthly low pattern to play out, with lower prices down into December's lows.

The move down into December's lows will depend on Financial stocks, Resource stocks, and also US markets....

http://usindexweekly.blogspot.com/2008/11/dow-s-weekly-29th-november-2008.html
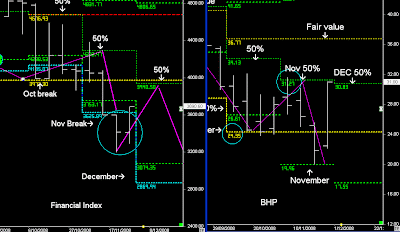

FINANCIAL INDEX & BHP (resource stocks)


Financial Index:-Banking stocks have struggled to bounce upwards in November because of the breakout of the November lows:- Financial Index resistance

These resistance levels shifts in December, so any bounce in this Quarter has the potential to move towards the December 50% levels, as resistance disappears.

It is the same pattern as the October breakout and November 50% level 'thrust' pattern downward.

Because of the breakout of the 4th Quarter, there is also the pattern of following the the market lower into December's lows in the Financial Index.

Resource stocks BHP:-

BHP drops the bid on RIO and BHP Shares rally back towards the Monthly 50% levels....

BHP thrust pattern down from November's 50% level into November's lows reversing upwards

At this stage I would treat BHP as range bound between the December 50% levels and the Monthly lows.

There could be a move higher towards fair value in December, but being a higher weekly open and in a bear market, I would view BHP as range bound between those levels.

Therefore there can be higher prices early next week, but at this stage I can't see the Aussie market higher than the December 50% level, but I do see lower lows in December when looking at Financials and Resource stocks.

The Reserve meets on Tuesday and the expectation of a cut on % rates.

How much is cut will obviously influence the direction of the market in the short-term.

Aussie ( SPI)Index Weekly 22nd Nov 2008


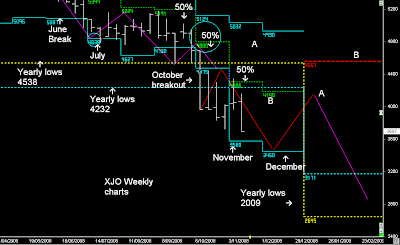
Australian Index: XJO

November 50% level push down into November’s lows, with the expectation of a 2nd wave down into December’s lows.

However, November’s lows haven’t held, which coincided with Resource stocks breaking their 4th Quarter lows on Wednesday, along with US markets moving down into their November lows the following day.

http://usindexweekly.blogspot.com/

Therefore I would look for a similar pattern as the October breakout, where price will probably swing back to retest the November low breakout @ 3584 sometime next week, and then more than likely continue down into the double low pattern in December.


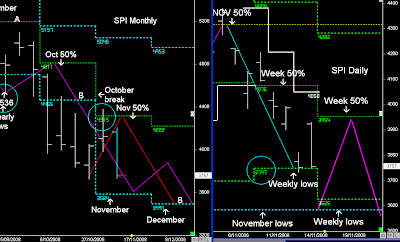
SPI Monthly and Weekly

Last Week I was looking for a down move on Monday and Tuesday to complete the November low pattern, and then from Wednesday to begin a swing back towards the Weekly 50% level, before the market continued down.

Except on Wednesday Resource stocks broke lower on the day they lift the 'short-ban' driving the market lower, and US markets were still much higher as they were moving down into their November lows:- Dilernia Model

However, I expected Resource stocks along with Financial stocks to continue lower this month, and slightly lower in December also.


Next Week:- October low breakout 3548, and expectation price will remain below this level for next week.

Personally I would like to see Monday and Tuesday next week continue the drive down into lower prices towards next Week's lows, and then see how Wednesday opens.

If Wednesday opens above Tuesday’s lows, we will probably see a short-term 3-day move back towards 3584.

If you notice the breakouts in multiple timeframes, price comes back and retests the breakout and then continues with the trend, which is what has been happening throughout this year.

A close below 3584 in November, will probably see lower prices in December.


What's going to push the market higher is Financials, and banking stocks aren't ready for any moves higher other than short-term 3 to 5 day up moves.

December's lows complete the double Monthly low pattern, which can provide a relief rally similar to when the double Monthly lows pattern occurred in March 2008.

And in late December or early January begin a major swing back towards the Yearly breakouts @ 4232

And the same pattern of a retest of the yearly breakout of 2008 :- 4232.

Which hopefully occurs in the first Quarter in 2009.


Therefore it can bottom out in December’s-January’s lows, and then swing back to reset of the yearly breakout. Which will take about 2-3 months to complete the move back.

After that move, I wouldn’t touch stocks because price will mostly come back towards to the previous lows over the following 3-6 months and continue lower in 2009.

As a new Primary timeframe begins, and probably move into lower lows in 2009.


  • Daily Trading Set-ups & Analysis
  • Index Futures SPI, DOW S&P, & Forex
  • Subscribe to the Trader Premium
  • http://www.datafeeds.com.au/premiumtrader.html


  • Aussie ( SPI)Index Weekly 15th Nov 2008

    XJO Australian Index

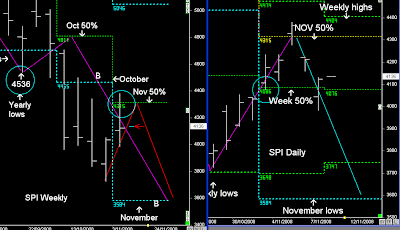
    Expectation that Global Index markets would swing back into the November 50% level and then continue down into November's lows.

    At this stage the expectation is that November's lows will form a robust support zone, but continue lower into December's lows.....

    Dilernia Principle:- 2 timeframe wave pattern on the breakout.

    Once December's lows are reached, then there is an expectation that market will swing back up to retest the Yearly low breakout @ 4232 , and then continue down in 2009.


    SPI Monthly and Weekly

    November's lows should be reached next week, which will coincide with the G20 meeting giving markets enough reason to reverse off their lows and swing back into the Weekly 50% level.

    But because of the monthly 2 timeframe wave pattern, I've modelled a lower low in December before the market reverses back towards 4200+.

    There is still an expectation that 2009 will go lower, but the pattern to confirm the market going lower is a re-test of the break early in 2009 then continue down into lower lows.

    SPI Monthly and Weekly 24 hours.

    In the 24 hour market :- the Dilernia Model has different levels because of the greater ranges.

    We often see price move in the day session within their own timeframe levels, but will extend to greater ranges based on the 24 hour model.

    In the day session the SPI continued down into the Weekly lows @ 3747.

    But in the 24 hour market, price continued down into it's own Weekly lows @ 3674.

    What do you notice when the market broke out of Octobers lows?

    The market moved in a 2 timeframe wave pattern down into the Weekly lows @ 3706 and then reversed back towards the November 50% level.

    Next Week the double Weekly lows @ 3559 match closely to November's lows, and the expectation of a swing back towards the Weekly 50% level.


    I'm not expecting markets to rise much further than the Weekly 50% level, but there is a possibility of a 4th Week UP move but more weakness in early December.

    Aussie ( SPI)Index Weekly 8th Nov 08

    SPI Monthly and Weekly

    Expectation that the Aussie market would swing back into the November 50% levels early this week, and then reject back down towards the November lows.

    At this stage the first pattern has played out, but if there is going to be a continuation down into the November lows, it will be lead by Financials (as per previous report), and my expectation of resource stocks moving down into their November lows.

    But it will also be helped by US markets...... http://usindexweekly.blogspot.com/

    If US markets don't sell off on Monday, then there is a view that next week could actually move back towards the Weekly highs.:- "consolidating Weekly pattern"

    SPI 5-day pattern

    Last week's trending period was mapped out using the 5-day pattern into Wednesday's highs.

    I was looking for a reversal back down into the 5-day 50% level once price moved back inside the upper blue channel, but sadly price gaped lower because of US markets reversal.


    Next Week:- If the Aussie market is going to continue higher, then it should be push upwards from the Weekly 50% level and be trading above 4173, moving into a consolidating 5-day pattern between the Weekly 50% level and Monthly 50% level.

    Below 4118, and my view will be the SPI heading down towards the 5-day lows:- 2nd week sell-off after the Monthly 50% level rejection.

    As I mentioned in last Week's report: my buy positions on stocks are much lower in November and i'll wait until things move down into the BUY levels.

    For short-term futures and Forex:- it's all about the 5-day patterns, filters, and Spiral points.


    • Daily Trading Set-ups & Analysis
  • Index Futures SPI, DOW S&P, & Forex
  • Subscribe to the Trader Premium
  • http://www.datafeeds.com.au/premiumtrader.html


  •