Aussie ( SPI)Index Weekly 27th Dec 2008


Australian Index SPI Futures Monthly

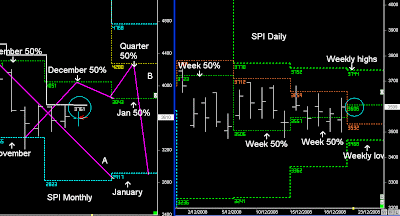
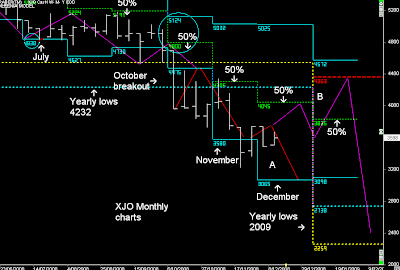
The Australian market is still in SET-UP A:- drifting lower below the Monthly 50% levels and following the dynamic timeframes lower, eventually pushing the market into lower lows in 2009.

Next week is the last week of trading for 2008, so it's important where markets close on the last day, as they will set-up the Primary cycles for 2009 and how far markets will go lower in the new year.

In the mean time next week's trading will still be defined by the 3-week highs, and SET UP B won't occur until there is a Friday close above those highs. (White line)


SET UP B
is the probability of markets moving back towards a 3-point level of 'TIME' before the market continues lower.

In this instance, Price in January would be rotating back towards the Yearly breakouts from 2008, the first Quarterly 50% level in 2009, and also the 3-month highs in January.

We also notice in the forward timeframe that there is now a higher low in the forward monthly timeframe, which often favours higher prices.

I still think all global markets will follow SET-UP B first before continuing lower in 2009, but if it doesn't markets will still go lower in 2009.
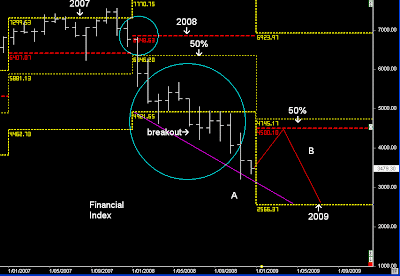

Financial Index

And the direction of the Financials will have a big bearing of the direction of the overall market.

The breakout of the 2008 lows in the Fin Index and the Financials were always going to struggle to move higher in the 2nd half of 2008, but I always thought the banks were moving into lower lows in the following year, as price follows the Dilernia Principle of 2 prices waves of time

And the financial Index will move down into the lower low in 2009.

So if you are thinking of moving into banks on the long side around those lows would be it.

At this stage the Financial Index is in SET-UP A and heading down into those 2009 lows, but there is still the possibility that SET_UP B plays out, and swings back into the higher timeframe 50% levels before price continues down into the lower lows for 2009.

Aussie ( SPI)Index Weekly 20th Dec 2008


SPI Monthly

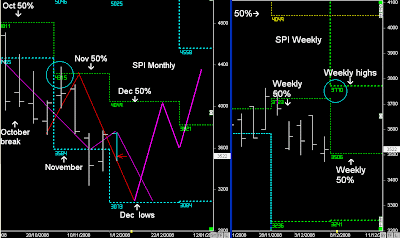
SPI consolidating since finding support around November's lows.

I still have an expectation that the Market will continue lower in 2009, but I would like to see the SPI rotate upwards into the Quarterly 50% level before it continues down in the new year.

But that won't occur until there is a Friday close and breakout of the 3-week highs @ 3761.

This is simply based on price rotating back into the higher timeframe midpoints before the next trend continues lower in the new year.

For every breakout price will normally come back and test the breakout in the next Timeframe and then continue with the trend. A perfect example was October breakout and then the rotation back into the November 50% level, and then Drive down into lower lows in November.


SPI Monthly and Weekly

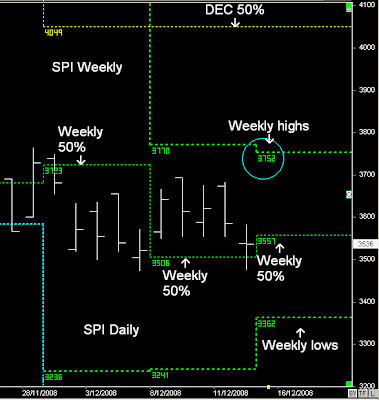
The down trend in the 4th Quarter ceased once price found support at the November lows but was verified with the shift in the Weekly 50% level @ 3506, and the market has now moved in a tight 3-week sideways pattern, which eventually price will breakout of.

As mentioned before, any up-trend won’t occur until there is a breakout of the 3-week highs.

Next Week gets interesting on the SPI as there is a divergence of the Weekly timeframes and a shift in the Filter from above to below @ 3532 (brown).

The downtrend can continue lower next week if trading below 3532 which is part of the bigger picture of continuing lower in 2009, and confirmed with a breakout of the 3-week lows.

But it also can be the spring board for the rotation upwards, which is what I think will happen, completing the retest of the Yearly breakout @ 4232 and the rotation back into the higher timeframe Quarterly 50% level.

As a SPI Futures day-trader I'll be trading on the side of 3606 as my bias either way next week.


  • Daily Trading Set-ups & Analysis
  • Index Futures SPI, DOW S&P, & Forex
  • Subscribe to the Trader Premium
  • http://www.datafeeds.com.au/premiumtrader.html


  • Aussie ( SPI)Index Weekly 13th Dec 2008

    Australian Market Yearly

    The Australian Market is going lower in 2009!!!

    However it depends how it's getting there that's the important thing when trading.

    Currently the Market is in Set-up A:- drifting lower below the Monthly 50% levels and following the dynamic timeframes lower.

    Eventually price will reach the 2009 Yearly lows, but it still won't be the lows for 2009. But i'll get back to that in a few weeks time in the new Year.

    Set-UP B:- Is what I think will happen or hope to happen.

    SET-UP B is based on a timeframe breakout.

    A Timeframe breakout normally comes back and retests the breakout at the start of the new timeframe, in this instance the Yearly breakout @ 4232 in 2008, and the start of the new Yearly timeframe in 2009.

    Therefore my expectation is that early in the first Quarter price will try to make it's way back towards 4232, and then continue lower.


    SPI Futures Monthly

    "Those 3-week highs in all global Index markets are extremely valid resistance zones, and have been all year.

    But eventually they will break, and markets will begin a rotation upwards as part of the larger timeframe cycles"
    Previous Weekly report

    We can see the test of the 3-week highs early on Monday and the push down.

    Set-up B won't occur until there is a breakout and a Friday close above those highs (3763)

    Once that occurs I'll be looking for a move towards December's 50% level (resistance), stall and another consolidation period for about 2 weeks, and then a higher move back towards the Quarterly 50% level in the first Quarter of 2009.

    That price action meets the Yearly timeframe breakout.

    Once that occurs I would be looking for the next leg of the down trend into the 2009 lows.


    SPI FUTURES WEEKLY

    As we can see there was a shift in the Weekly 50% level from top to bottom, and whilst price is trading above the Weekly 50% levels, I still have the view that markets should be heading higher, but we need to verify this with a breakout of those 3-week highs.

    For Day traders they can see the same re-occurring patterns over the past 3 weeks, Higher daily opens result in lower Daily closes, and lower Daily opens result in higher daily closes.

    Eventually there will be a breakout of the 3-week range and will result in the next trending period, which in fact is simply the rotation back towards higher timeframe 50% levels, and the next 'Thurst' pattern based on the Dilernia principles of following the Primary cycles of the market into new lows in 2009.

    Aussie ( SPI)Index Weekly 6th Dec 2008

    SPI Monthly and Weekly charts

    The trend is down and the expectation is that the Trend will continue lower in 2009.

    Currently I have the view that global markets are moving lower into December's lows and complete the double monthly low pattern before a potential reversal upwards.

    However, I've always maintained that for any trend to continue lower in 2009 price needs to swing back upwards and move back towards the 3rd Quarter breakouts (September).

    This will result in the retesting of the 2008 Yearly timeframe lows verifying the breakout, and then continue lower in 2009.

    Once that UP move occurs, my view is that breakout level will form a resistance zone and markets will be moving lower in 2009.

    But things get extremely interesting next week in all Global Indexes and currencies...

    The important part on any trend continuating lower, or even any major trend reversal begins with the break of the 3-week channels, in this instance the 3-week highs

    Any long term trend won't change unless there is a breakout above the 3-week highs, and then continues above the Monthly 50% level.

    This normally occurs with a Friday close above the Weekly highs, and the following week continues higher.

    Any continuation of the long term trend (down) normally occurs with price retesting the 3-week highs and then rejecting downward, as it continues with the trend towards the Monthly lows.


    SPI Weekly and 5-day pattern

    Last week's view was a higher Weekly open and a 2 day down move. That played out and then the next 3 day's consolidated within the 5-day range and the SPI Primary Range of 87 points.


    Next Week:- I have the expectation that Global markets are moving towards the Weekly highs next week. http://usindexweekly.blogspot.com/

    Around those Weekly highs and the view is resistance ( until broken with a Friday close above), with the expectation of a move down into December's lows to complete the 2-monthly timeframe pattern.


    A breakout and Friday close above those Weekly highs, and my view is that markets are moving back towards higher Monthly close in December, as it goes looking to move back to re-test the Yearly breakout in early in 2009.

    Therefore for any reversal upwards needs to see a Friday close above 3770.


    The trend remains down and the expectation is that market's will continue down, but any reversal upwards in the medium term will begin with a breakout above those 3-week highs confirmed with a Friday close above them.

    Those 3-week highs in all global Index markets are extremely valid resistance zones, and have been all year.

    But eventually they will break, and markets will begin a rotation upwards as part of the larger timeframe cycles.