Australian Index Report 29th March 2008

SPI Weekly Report

SPI Weekly Chart

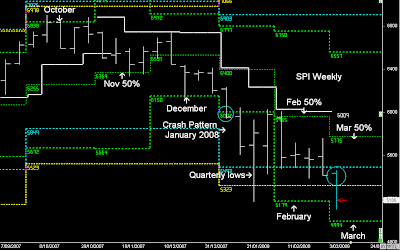
The reversal upwards from March lows and the higher move on Tuesday has pushed price back into the 3-Weekly cycle highs @ 5464.

In 'Bear' Markets' price won't spend much time above 5464, and the failure around that high yesterday is an important level and reference point.

5464 could end up being a major resistance level for many weeks, and that will only change once there is a 'friday' close above that level. (March 27th)
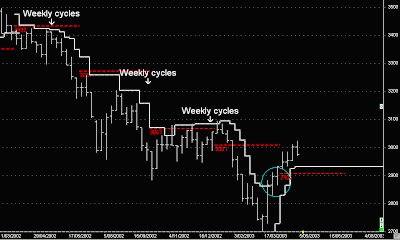
SPI Weekly charts 2002-2003

As I pointed out on the 27th March....Above is the Weekly charts in the last down-trend in 2002-2003, and we can see how important the Weekly cycles are in defining the overall trend of the market....

And it was until 2003 (double Yearly low pattern) that the Weekly cycles defined the UP trend reversal, which matches my view of lower lows in 2009.

SPI Daily chart

"January Crash pattern 'breakout' and a 2-monthly wave pattern lower into March lows.

Expectation is now that the SPI will rotate back towards the April 50% levels

March lows were reached and bounced, and the first sign of a reversal taking place was the move above the 3-day highs.

Therefore:- the bounce off the Monthly lows needs to be confirmed with the break of the 3-day cycle highs and then continues higher in the following week using the Weekly 50% level as a trend guide towards the upper Weekly channels. (5443) "
..... Previous Weekly Report


This Week was the first time price was able to trade above the previous 5-day high pattern in 2008, and it remained above the 5-day highs all week, with Friday supporting the market.

The Weekly highs @ 5443 played a major resistance level, and the expectation was that price is being pushed down into April balance points before any higher move can take place.

Next week price can go higher, as the Weekly channels have shifted upwards to 5521.

A higher move can take place:- a robust pattern of a test and bounce off the April balance point at the start of the new Quarterly timeframe.

SPI intra-day 5-day chart

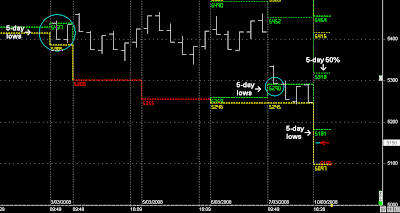
Last Week like all Weeks was about using the 5-day levels in the market, along with trading in the direction of the Spiral points.

As you were probably reading the Daily reports, you know that my intra-day shorting levels were 5417 and 5443.

I spent most of the time 'short-trading', and only Friday did I trade my first longs around the Support of the 5-day 50% levels and the breakout above the 5-day highs @ 5343.

Note: As I pointed out in the book, UP trends and volatility drops.

This doesn't change the trading patterns and they way I trade, but it certainly changes the frequency of the amount of trading I do because the range rotations drop.

Hence:- In return the potential profitability drops..

In conclusion:-

The trend remains down and can go lower in the next Quarter, because of the failure of the Weekly cycle highs @ 5464, and the overall bear trend defined by the Dilernia model. (Primary and Secondary timeframes)

But the trend will be clearly defined by next week's April balance point, and a higher move can head towards 5521 next week.

It can also go down if it's trading below the same April balance point.

The next 3-months of trading looks like a major consolidation pattern with a slight UP bias, but there will continue to be resistance levels around any higher Weekly channels using the Dilernia model using market dynamics.

Please refer to the Daily Blog... 'the trader trading"

All information is owned and copyrighted by Frank Dilernia and cannot be reproduced without consent

SPI Weekly Report 22nd March 2008

SPI Weekly chart

January Crash pattern 'breakout' and a 2-monthly wave pattern lower into March lows.

Expectation is now that the SPI will rotate back towards the April 50% levels, but traders need to keep in mind that the next Quarterly timeframe is pointing lower, and we still haven't reached the Yearly Support lows for 2008.

Banking stocks look supported but range bound in the next Quarter, whilst mining stocks look to be the ones most vunerable and could come off much further in the next Quarter ...(Read BHP stock report)

SPI Daily Chart.

March lows were reached and bounced, and the first sign of a reversal taking place was the move above the 3-day highs on Wednesday.

The 2nd sign of any continuation upwards is going to be next Week's 50% @ 5231.

Therefore:- the bounce off the Monthly lows needs to be confirmed with the break of the 3-day cycle highs and then continues higher in the following week using the Weekly 50% level as a trend guide towards the upper Weekly channels.

In 1 week's time April will start and the Balance point for April will be extremely important in the trend direction

SPI Intra-day charts (Recap)

Monday was about trading shorts down towards the March lows.

Tuesday was about trading longs from lower spiral points because of the expectation that the market would swing upwards.

Wednesday was about 'short trading' the higher open and gap down towards the 5-day 50% levels

Thursday was about using 5254 as a trend guide.

Next Week:- is simply going to be about the 5-day 50% levels, and obviously the Weekly 50% level

Please refer to the Daily Report....

SPI Weekly Report 15th March 2008

XJO Weekly charts

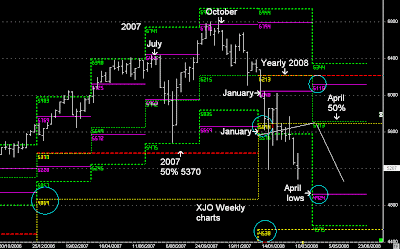
The further this Quarter pushes down, the lower the next Quarter will travel, and any UP side back to the trailing 50% level in the next Quarter is going to be less.

And the Quarterly lows in the next Quarter is starting to get close to my overall downward target in 2008 @ 4538.

"On Monday price will be opening around the Weekly lows @ 5165, and the expectation remains that price is moving down into March lows. Any reversal upwards from Weekly lows and it's only viewed as a short-term 2-3 day pattern before the trend continues down into March lows." Last Weeks Report.....

SPI Futures Weekly and Daily Charts

Daily counter-trend upwards within the overall Weekly down trend, and next Week's channels lows are now dynamically pushed down matching March Monthly lows.

We can see last Week's trading and 5-day sideways pattern supported around the Weekly lows @ 5156, but those Weekly lows for next week are now pushed further down @ 4999.

And with SPI opening on Monday below last Week's lows @ 5156, there is going to be more chance of downward follow through.

SPI Intra-day 44 point Range Charts

Monday Last Week had the Weekly lows and 5-day lows as initial support.

This Monday there is no support to help to market to move upwards. The only support in the short-term will be the lower 'Spiral-point'.

At this stage Monday looks to be heading down.

Note: As mentioned last Week......

"The 5-day ranges are a major driving force in the market, and the levels often play support-resistance, and also attract price towards the levels each day. The further the level away the greater the market will move.

However within the trading day, the range rotations don't always play out the same, yesterday was heavily influenced by 22 point rejections, whereas other days are often influenced by smaller ranges when markets consolidate (14-18 points)

On Tuesday 44 points was a major trading range, because of the 5-day levels (support-resistance), this was also the case on Friday, along with 22-point range rotations.

It is often a good idea to keep an eye on price action within the trading day and adjust, espescially after the first 90 minutes of trading has taken place (thrust), because it will give intra-day traders a good idea on short-term 'scalping' trading whilst the market is travelling from one level to the next, or consolidating above or below the 5-day levels."

Please Read the Daily Report's each day......

SPI Weekly Report 8th March 2008

XJO Weekly charts

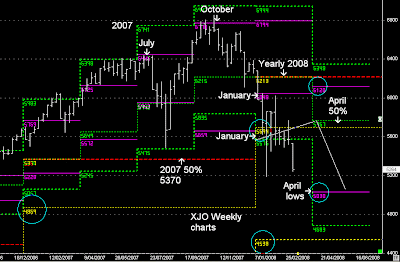
Expectation of the 2nd wave down from April has started earlier in March, and the next Quarterly lows are being pushed further down.

What that basically means is that: the reversal back upwards into the April 50% level is going to be much less and will be relatively flat, and the potential down move in the next Quarter is going to be greater.

We can see how valid the 2nd phase of the bear market has been, as it's consolidating under the Yearly 50% level with the view that the bear market will move down into a 2 year wave pattern lower.

I still have the view that price will re-test the 50% level in the next Quarter, but the reversal upwards is going to be much less than if price had remained supported....


"SPI is back down into Quarterly support, with the expectation of further weakness down from the next Quarter in April.....However, SPI futures has closed on a Monthly timeframe (last day of the month) below Quarterly support. This isn't a good sign when the Monthly timeframe closes outside a major support zone on it's last day." Previous Weekly report


SPI Weekly Chart:- Last week’s close on the last day of the Month below Quarterly support was the first sign that these support zones would fail.

The 2nd sign was the break of the 3-week lows, with the expectation that the market path would begin a move down towards the March Lows.

This was helped by the US market following the exact same pattern of the Weekly Range breakouts.

SPI Daily chart:- On Monday price will be opening around the Weekly lows @ 5165, and the expectation remains that price is moving down into March lows.

Any reversal upwards from Weekly lows and it's only viewed as a short-term 2-3 day pattern before the trend continues down into March lows.

SPI Daily and SPI 24 hour chart

We can see the difference in Weekly ranges when we take into effect the overnight market action and larger Ranges.

What is a Weekly low in the day session, is much further down in the 24 hour market, with the Weekly lows @ 5013.

Intra-day 44 point Ranges

And each move is based on the 5-day ranges:- below 5181 on Monday and price is moving lower.

Above 5181 and price is starting a 2-day upward move before it continues down:- ideally from the 5-day 50% level...

But the market is going down into March lows and Support.....(Next Consolidation Phase)

Please read the Daily Report.....