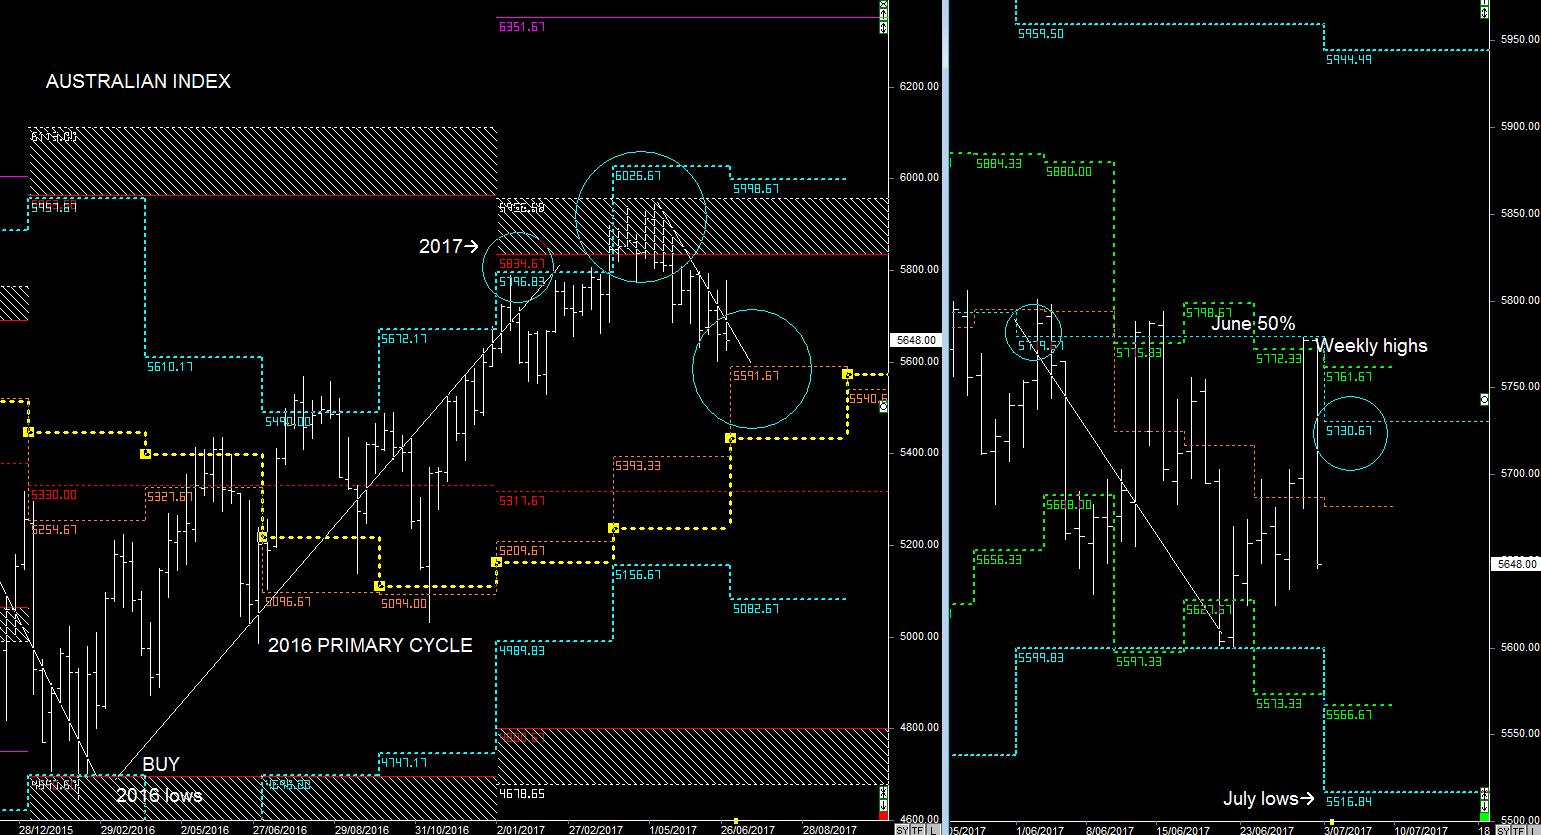
SPI Primary & Weekly Cycles
The 2017 Yearly highs on the Australian Market can form resistance once again and as well as the case with every quarter this year (Blue Channel highs), but if it breaks out of those Quarterly highs @5922 look for a continued rally into 2018
This whole process is part of a multi-year rally from the 2016 lows, so I'm looking for more upside into 2018 and beyond.
The Market has remained above the Quarterly highs @ 5922.
There could be a quick dip down into the Weekly lows, but at this stage trade on the side of 5922 with the expectation December will continue to move higher.