Aussie Index (SPI) 31st Jan 2009 Weekly

"As per Monthly rejection patterns:- expectation that Global Index markets are heading down towards the January's lows, and then will continue down further into February's lows.

Another pattern that I favour after a 3 week trend, is a Weekly timeframe that actually closes higher, before the trend continues lower the week after in the following Month"


Previous Weekly Report


Australian Index Futures (SPI)

January continues down as part of the 2-month down trend towards February's lows:- Dilernia Principle

As per previous weekly report, I was looking for an UP week before the market continues down in February's lows.

Even though the continuation down into the lows would have aligned nicely with the February 50% level and another 'Thrust' pattern, that might not be the case....

SPI Weekly

The SPI could continue higher next week into the Weekly highs and February 50% level....


But I was only looking for a 1 week UP move before the trend continues downwards at the start of February.

Basically the Weekly 50% levels will define the trend next week, and which direction the market will take.

Note:- I would like to see the SPI and other global markets continue down into February's lows in the first 2 weeks of the month.

Why?

Because if that can occur it will complete a 2-month pattern in the first Quarter.

And it will probably give markets the first decent bounce for Months.

Even though I think market will go lower in 2009, I'm not factoring lower prices until the 2nd or 3rd Quarter.

Basically I would like to see a drive down into February's lows in the first two weeks, find support and then we could probably get a 25-30% bounce off the lows.

Note:- if the SPI moves up next week towards February's 50% level, markets will probably continue to follow the pattern of rejection and continue to drift lower, as they have for the past 6 months towards the Yearly lows.

Aussie Index (SPI) 24th Jan 2009 Weekly

SPI Monthly

As per Monthly rejection patterns:- expectation that Global Index markets are heading down towards the January's lows, and then will continue down further into February's lows.

And those February lows won't be the end of the move down until it starts trading around the 2009 Yearly lows, which could hit in the first quarter (March) but more likely in the 2nd Quarter.

SPI Weekly

The expectation that price would move down towards January's lows aligned with markets reversing down from the monthly 50% levels, but verified once price was trading below the Weekly 50% levels.

As each weekly timeframe completed, there was a new low for price to follow.

And in the case of Friday's breakout of the Weekly lows @ 3426, expectation that the SPI should move down into 3217 next week, and maybe hit the January lows.

However, another pattern that I favour after a 3 week trend, is a Weekly timeframe that actually closes higher, before the trend continues lower the week after in the following Month.


At this stage I can't guarantee a higher Weekly close, because early next week I favour more weakness down into the Weekly lows , but if price stabilises in the first 2 days even without reaching the January lows, I would then see if there is a potential higher close by Friday.

This higher close with probably be lead by the US markets following the same pattern.


If this is the case, then this sets up more weakness the Week after as price continues down into February's lows.

  • Daily Trading Set-ups & Analysis
  • Index Futures SPI, DOW S&P, & Forex
  • Subscribe to the Trader Premium
  • http://www.datafeeds.com.au/premiumtrader.html


  • Aussie Index (SPI) 17th Jan 2009 Weekly


    SPI Monthly 2009

    As per Monthly rejection patterns:- expectation that Global Index markets are heading down towards the January's lows, and then will continue down further into February's lows.

    This follows my view of global markets including the Australian Market making lower lows in 2009.

    What's the chances of SET-UP B playing out?

    SET UP B is the probability of markets moving back towards a 3-point level of 'TIME' before the market continues lower.

    In this instance, Price in January would be rotating back towards the Yearly breakouts from 2008, the first Quarterly 50% level in 2009, and also the 3-month highs in February.


    Much less so at this stage, but often markets do come down into the Weekly lows, verify support and then continue upwards from a lower Weekly open and rise upwards.

    SPI Weekly

    Last Week's view was once price was below 3691 it was heading down into 3481 and the Weekly lows.

    At this stage the Weekly lows have verifed support, but at this stage my view of the SPI
    Next week is that it will be range bound between next Week's Weekly lows and the Weekly 50% level.

    Keep in mind that the overall trend is down, therefore the Weekly lows can often support the market but much less so because they are a lesser trends within a higher timeframe monthly trend with is pushing price down.

    Now regardless of the trends, what's going to define the Australian market next week is how BHP responds to its profit results coming out on the 21st January.

    BHP has extremely valid support around $28.00 that could see price push back up towards $33.00.

    But only if it's good news.

    IF BHP responds favourably then this can also drag RIO TINTO back towards $53.00

    A break of $28.00 on bad news and BHP will continue down, and RIO will follow.

    And the Aussie market goes lower, which at this stage is what I'm expecting, and nothing tells me otherwise:- Primary cycles in 2009 is to make lower lows


    SPI 5-day pattern

    Even though the SPI moved down from 3691 down into 3481 :- 200 points....

    There wasn't a breakout of the 5-day range until Thursday @ 3560.

    The rest of the days followed the price patterns of rotation up from support and back into central zones, and then the continuation lower from those central zones outward, as it followed the Weekly trend down.

    Even though I've always believed that the most robust template for Day trading markets is the 5-day pattern, the 5-day pattern must be taken into context with the overall trend.

    Understand where the market is going, then you''ll be able to use the 5-day pattern to it's full potential.

    Day-traders simply follow the 5-day pattern set-ups found in the Premium Report

    This is the only report you'll find that strips the market down from top to bottom, and provides the most comprehensive analytical view of global markets that you'll find anywhere


    • Daily Trading Set-ups & Analysis
  • Index Futures SPI, DOW S&P, & Forex
  • Subscribe to the Trader Premium
  • http://www.datafeeds.com.au/premiumtrader.html


  • Aussie Index (SPI) 10th Jan 2009 Weekly

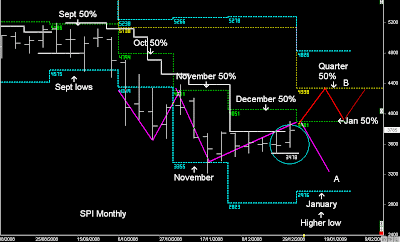
    All we have seen is price rotate back towards the Monthly 50% levels, and the market remains in SET UP A.

    SET-UP A:- drifting lower below the Monthly 50% levels and following the dynamic timeframes lower, eventually pushing the market into lower lows in 2009"


    Previous Weekly Report


    Australian Index Futures (SPI Monthly)

    At this stage Global Markets remain in SET-UP A...

    And this is far better illustrated when looking at the US markets:- DOW and S&P.

    http://www.usindexweekly.blogspot.com/


    When looking at the Monthly charts we can see the influence of this timeframe when we define the larger trends of the market and likely direction price will follow:- rotation & extension (trends), Support & Resistance.

    SPI Weekly Charts (Daily bars)

    We can see Support defined in the Monthly chart around November's lows, but it wasn't until price move above the Weekly 50% level 3-weeks ago, that the bias changed and began to rotate towards the Monthly 50% level.

    The entire methodology is based on the rotation towards central zones and the extension outward from central zones over a multi timeframe model.

    The key principles of technical analysis are:- identifying support/resistance and trends.

    The key principles of the Dilernia Model is using TIME & PRICE to identify support/resistance and trends, but also understanding that those parameters shift dynamically as TIME moves forward.

    The Key Trading set-ups are:- trading from the midpoints outward, as all trends originate from the 50% levels and extend outward.

    For day-traders or swing traders we apply the 5-day pattern model and use the same principles :- trade towards the mid points and trade outwards using statistical ranges of the ATR (Average True Range)


    In last Week's report :- "I view the market still range bound between the Weekly highs and the Weekly 50% level"....

    Price didn't get as high as the Weekly highs but remained range bound and supported above the Weekly 50% level @ 3681.

    Next Week:- I'm beginning to feel that the SPI will struggle to move higher, simply based on the price action in the DOW and S&P, and probably move back down towards its Weekly lows @ 3481

    Aussie Index (SPI) 3rd Jan 2009 Weekly


    Australian Index XJO Yearly timeframe

    End of 2008 and the beginning of the new Primary cycles for 2009.

    Trading range between the 50% levels and the 2009 lows.

    As we saw in the 2007 highs, there can be lesser timeframes (Monthly) that push the market further than the actual Yearly ranges.

    There is a breakout in the 2008 lows and the Aussie market will struggle to move higher than those 2008 lows, which align with the 50% levels in 2009.

    Once those rotation back towards the 50% levels play out, I would look for the next unwinding pattern into lower lows in 2009, which has been my view since price crossed over the 2008 50% levels @ 5750.

    Dilernia Principle:- 2xtimeframe pattern extends outward


    SPI Futures Monthly

    "We also notice in the forward timeframe (January) that there is now a higher low in the forward monthly timeframe, which often favours higher prices" Previous Weekly Report

    This week saw higher prices, however all we have seen is price rotate back towards the Monthly 50% levels, and the market remains in SET UP A.

    SET-UP A:- drifting lower below the Monthly 50% levels and following the dynamic timeframes lower, eventually pushing the market into lower lows in 2009.

    I was looking for SET-UP B to begin :- Price in January would be rotating back towards the Yearly breakouts from 2008, the first Quarterly 50% level in 2009.

    But for me to be confident that SET-UP B was going to occur was for Price to actually rotate all the way back towards the December 50% level @ 4051.

    This would have put the market above the January 50% level and all we needed was for price to come back down into January 50% level, test support and then continue the wave structure upwards.

    At this stage we haven't done that and we still remain below the Monthly 50% levels.

    SPI Future Weekly

    At this stage I view the market still range bound between the Weekly highs (January 50%) and the Weekly 50% level.

    As we can see there has now been a shift in those levels at the start of January, so there will be higher prices, but it's too early to confidently say that January will continue UP towards 4300, other than remain between the Weekly channels.