SPI Primary cycles
The Primary cycles in the Australian Market suggests that the trend will continue down towards the lower levels in 2012, which will once again be long term BUY zones for stocks.
However, in the S&P 500 (read US Index report), the same bearish patterns aren't showing, as the trend will begin the new year above its own higher timeframe 50% levels.
That means that the Australian market could move up towards the higher timeframe 50% levels (1st Quarter) and the Yearly 50% level @ 4389 and BUTT its head against those levels for awhile....(3-6 months)
continue below....
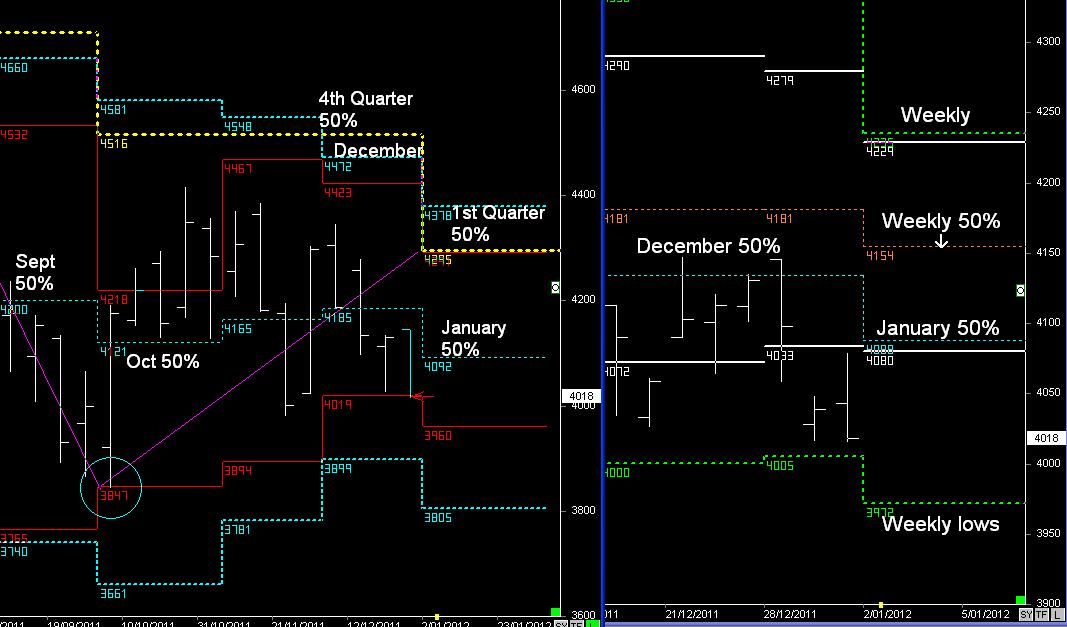
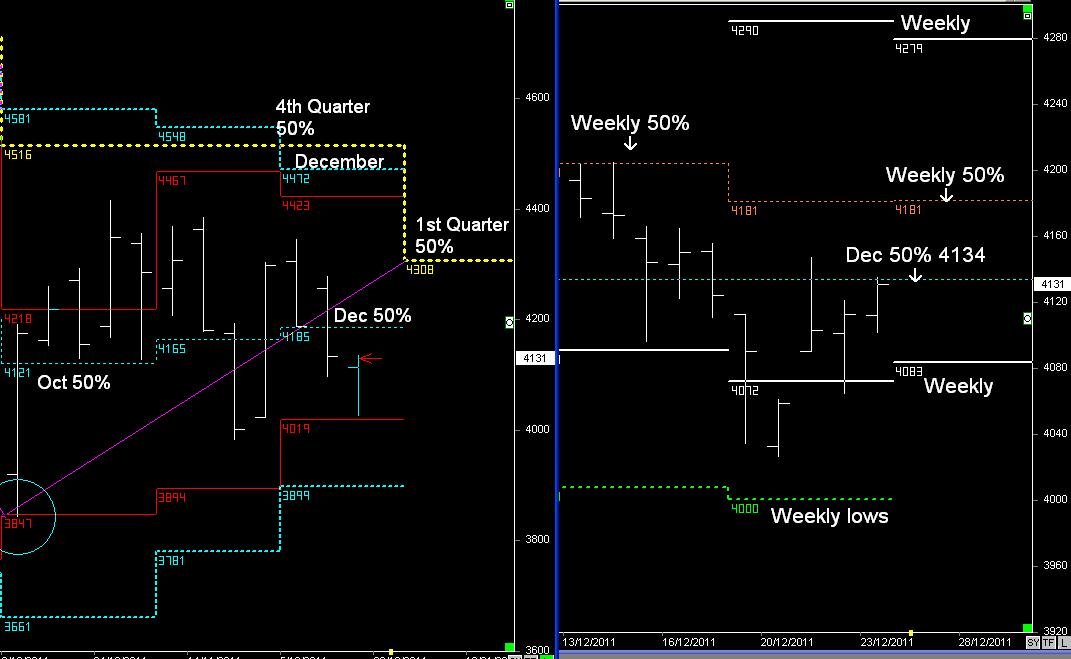
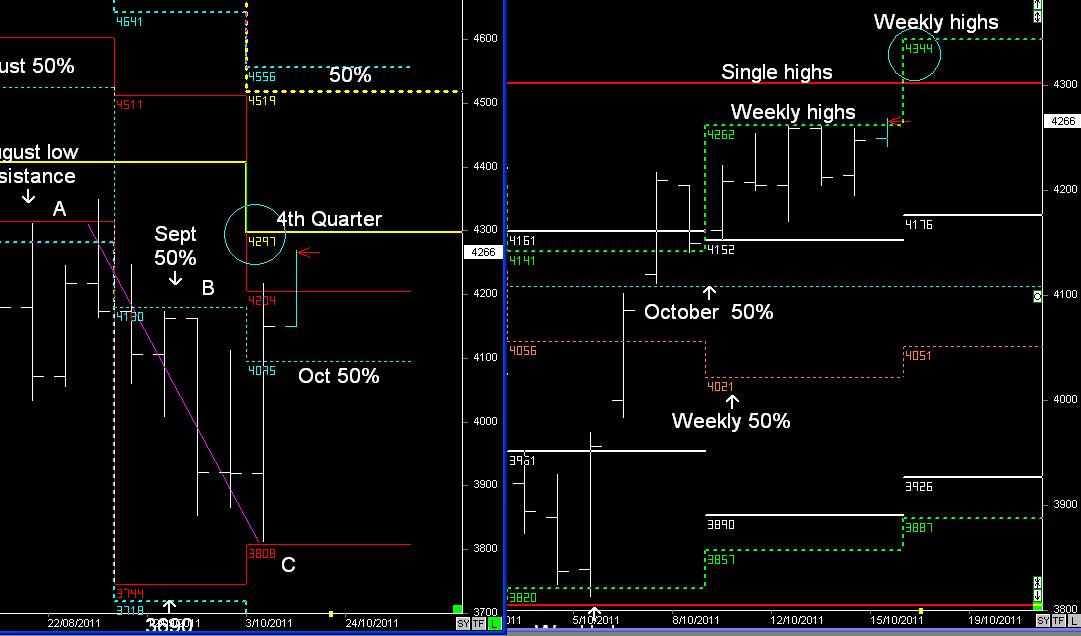
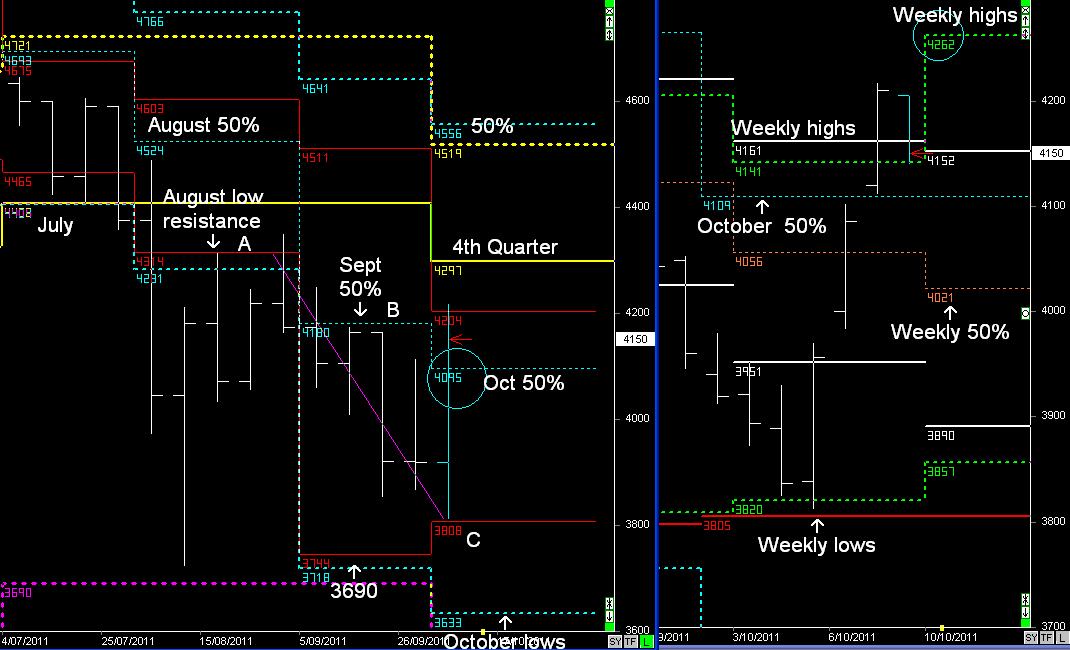
SPI Monthly and Weekly
All the lesser timeframe cycles are bearish, and remain bearish as long as the trend remains below the monthly 50% levels.
But as we can see, it won't take much for price to move above the January 50% level @ 4088 and swing back towards the Weekly highs, and then the 1st Quarter 50% level @ 4250 to 4292
Helped by the S&P 500 remaining above its Critical Support level @ 1235.75