Aussie ( SPI)Index Weekly 30th August 08

"Ideally I want to see a completion down in this quarter to bottom out the markets, so we can finally get a 3-month counter-trend move upwards.

4th Week:- last week of the month often starts the next trend, which leads into the continuation of the trend in the following month, but who is not to say that next Week just continues higher"....

Previous Weekly Report
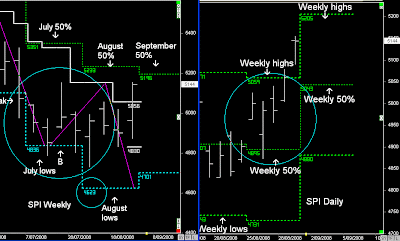


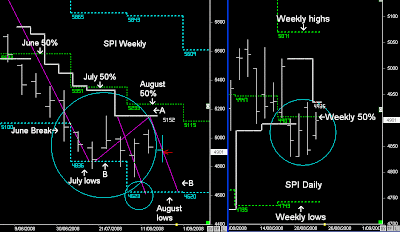
SPI Weekly and Daily charts

I've been bearish on the market in this Quarter with the expectation that price would make lower lows in August before a 3-month counter-trend upwards would occur.

But when certain things happen I have to acknowledge that a continuation downward in this Quarter might not eventuate.

Even though price is still trading below the Monthly 50% levels in September, This week's 4th week rally and breakout of the 3-week highs normally shows further strength in the new month....

SPI Weekly futures

Above is the SPI Weekly futures showing the 3-week cycles (White line)

Whenever price closes on the opposite side, the market often reverses the trend.

It occurred in March and June, and now in August.

The big difference between the two previous 3-week breaks and now are:- I had an overall view that price was reversing from March lows and moving into a 2-month rally into May's highs. In June I had the view that markets were coming down from May's highs into a lower low pattern in July.

In August I don't have a view on any counter-trend move upwards.

I do have the view of a 3-month UP move, but only if it made lower lows this Month, which it hasn't.

Therefore:- like in April this year expectation still remains that September 50% level is resistance which could last for the next 2 weeks (more consolidation):- Ideal for spiral point trading and 5-day patterns.

And if price does continue higher towards October's highs it should push higher in the 3rd week.

Note:- Contract expiry this month.

Expiry of contract normally supports the market or even push higher into Expiry.

SPI 5-day pattern

"Personally I hope it remains in a sideways pattern, especially when day trading futures....

These markets are ideal for the way I trade:- consolidating trading patterns of weekly sideways price action favours swing trading, which is the core theory of spiral point trading (c).

There is enough volatility in the market that it moves 87 points and not just 44 points.

When markets trend in one direction, the frequency drops and volatility drops especially when Market rise, not so much when markets go down.

The end result in trending markets are, my profits drop because my frequency of trades drop"


And last week's 5-day pattern in the SPI was ideal and text book spiral trading, and hopefully for the next two weeks it remains the same.....

Aussie ( SPI)Index Weekly 23rd August 08

SPI Weekly and Daily charts

Australian Index is consolidating in a sideways pattern over the past two months.

Ideally I want to see a completion down in this quarter to bottom out the markets, so we can finally get a 3-month counter-trend move upwards.

I was hoping that US markets would leads us down (Read US Weekly Report), but Friday in the US moved higher.


At this stage the June breakout and Monthly 50% level are still view as resistance until they breakout, and they will breakout:- But my breakout starts with a touch of the lows before price usually continues higher.

I've mentioned previously that any UP move will begin with US markets leading the breakout, and that remains, so at this stage the view remains more consolidation unless the last Week of this month continues higher.

4th Week:- last week of the month often starts the next trend, which leads into the continuation of the trend in the following month, but who is not to say that next Week just continues higher....

Personally I hope it remains in a sideways pattern, especially when day trading futures....

These markets are ideal for the way I trade:- consolidating trading patterns of weekly sideways price action favours swing trading, which is the core theory of spiral point trading (c).

There is enough volatility in the market that it moves 87 points and not just 44 points.

When markets trend in one direction, the frequency drops and volatility drops especially when Market rise, not so much when markets go down

The end result in trending markets is my profits drop because my frequency of trades drop.

Hopefully markets don't go up yet.....


  • Daily Trading Set-ups & Analysis
  • Index Futures SPI, DOW S&P, & Forex
  • Subscribe to the Trader Premium
  • http://www.datafeeds.com.au/premiumtrader.html


  • Aussie ( SPI)Index Weekly 16th August 08


    Australian Cash Weekly charts

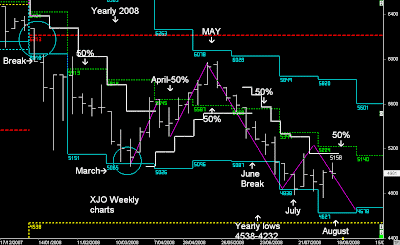
    Currently Range bound this Quarter trading below the breakout of June's lows, and at this stage there is an expectation that in 2008 prices will move lower before they bottom out....

    Commodity prices are moving lower, which are weighing heavily on our Resource stocks, even though BHP will announce a record profit next week...

    SPI WeeklyFutures

    Markets have stabilised and have moved into a sideways pattern, underpinned by US markets moving higher and reporting season.

    BHP reporting on Monday and some financial stocks reporting this month supporting the market.

    SPI Daily

    We can see how congested the market is this month, and at this stage I can't see any difference next week.


    Next Week:- Range bound which will be heavily influnced by US markets, but Monday should be driven by the market's reaction to BHP record profit announcement.

    Any new down trend won't occur until US markets lead..... (Read US Weekly Report) , and dragged down by Financials to bottom out the market.

    Aussie ( SPI)Index Weekly 9th August 08

    "July's lows supported the market, and if the market was going to go higher, then it was based on the open of August and it's direction based on the midpoint @ 5000.

    As mentioned in last week's report:- an open below that level in August and expectation price is moving down towards August lows, as it follows the B setup.

    Day traders:- simply trade the 5-day levels using Spiral point techniques"

    Previous Weekly Report


    SPI Weekly and Daily charts

    The Aussie Market opened below 5000 at the start of August and began the next wave down, as part of the B Set-up, continuing down into the Weekly lows completing the first stage of the sell pattern.

    Whereas in the US, those markets closed above their 50% levels, which favoured a rise higher into Friday

    (click link to read DOW and S&P Weekly Reports)

    http://www.usindexweekly.blogspot.com/

    Often global markets move in unison, we saw this in the lows in March, the lows in July, but the 'pop' upwards in August wasn't aligned in the Australian market compared to the US markets.

    Most of the UP moves in the market were because of the US markets continuation higher providing the higher opens.

    Next Week:- price is trading above 5000, and the short-term view is to continue higher into the Weekly highs @ 5159, and could go as high as 5233 (following Week)

    Ideal pattern would be a test and reject pattern from the Weekly 50% level.

    After that completes I don't have a long term view on the market for another 5-days.

    • Daily Trading Set-ups & Analysis
  • Index Futures SPI, DOW S&P, & Forex
  • Subscribe to the Trader Premium
  • http://www.datafeeds.com.au/premiumtrader.html

  • Aussie ( SPI)Index Weekly 2nd August 08

    XJO Weekly Charts

    The Aussie Index is moving down into the Yearly lows, which will probably be reached in September.

    From the Time price was trading below 6213 (Bear Market :- Dilernia Principles), the downside target in 2008 were the Yearly lows.

    And along with support, swing patterns, trends, resistance, and cycles:- the market structure was precisely mapped out based on the timeframe parameters defined by the Dilernia model.

    Price doesn't move in a straight line, it zig-zags its way based on waves of 'Time'. A support level is valid for the current timeframe, once that timeframe ends the levels of support 'shift' and dynamically move forward, allowing the trader to have a trading model that is forward looking.

    As is the case with July's support:- vaild for the current monthly timeframe but shifts forward at the start of the new timeframe. What support that existed in July won't be valid in the month of August.


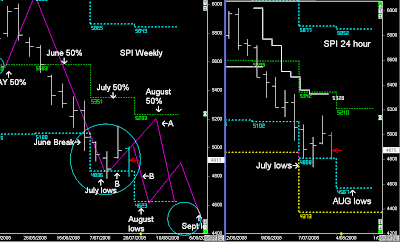
    SPI Weekly and 24 hour charts

    Expectation is that the Aussie Index is moving down into the Yearly lows around 4538which is starting to align with the August lows.

    I've put up both charts showing a difference in levels with the August lows, and if the SPI ends up lower it will probably occur in September, which could push lower based on the next monthly dynamic range, but I'll come back to that in 4 weeks time.

    September could see the market as low @ 4373.

    I can see the aussie market around that level in September, but I'd be surprised to see the market much lower in 2008. However, I do expect a lower low in 2009, which will be determined by the closing price of 2008 on the last day of the year.


    SPI Daily and 5-day pattern

    July's lows supported the market, and if the market was going to go higher, then it was based on the open of August and it's direction based on the midpoint of August @ 5000.

    As mentioned in last week's report:- an open below that level in August and expectation price is moving down towards August lows, as it follows the B setup.

    Day traders:- simply trade the 5-day levels using Spiral point techniques.


    • Daily Trading Set-ups & Analysis

  • Index Futures SPI, DOW S&P, & Forex

  • Subscribe to the Trader Premium

  • http://www.datafeeds.com.au/premiumtrader.html


  •