Aussie Index (SPI) 25th June 2011 Weekly

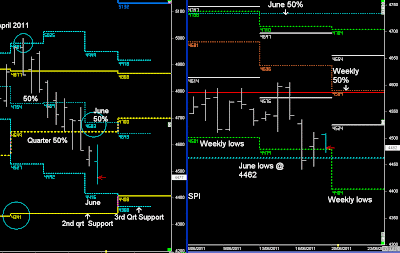
The Australian market has now the potential to rise upwards from the June lows, as part of a short-term counter-trend move..

However, any rise upwards will be seen as temporary, because trends that are rejected down from the 3rd month 50% level (June 50% level) will often extend towards lower lows into the following quarter.


Previous Weekly report


SPI Weekly cycles

June lows supporting the Market, and there is the possibility that the Market rises upwards next week, if above 4487


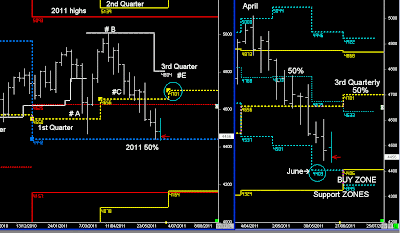
However, the June 50% level rejection pattern is trying to push the market towards the July lows in the 3rd Quarter, as shown in the following chart.
Primary and Monthly cycles

The Primary level @ 4442 is supporting the market, and may continue to do so...

However, as mentioned a few weeks ago, the rejection pattern is trying to push the trend down into the BUY zones in the monthly cycles.

Those BUY zones are my levels that I believe will provide the most robust support levels for the market to rise upwards from.

That upward rise is back towards the 3rd Quarterly 50% level (Yellow)

Once that happens, I feel that the market will once again move into another large 3-month sideways pattern. I'd be very surprised to see the market spend too much time above that level, even though it could go as high as 4804.

There are two things that could go wrong with my analysis....

#1) the trend doesn't continue down into BUY zones, but actually rises upwards from next week and moves up into the 3rd quarterly 50% level, and as high @ 4804...

if that happens, then I expect the same consolidation pattern for the rest of the 3rd quarter.

#2) support levels fail, and the market continues down towards 4157 by the end of 2011.

Aussie Index (SPI) 18th June 2011 Weekly

If there is going to be a counter-trend move upwards, then is most likely going to align with the June lows @ 4460/62, and the S&P 500 finding support @ 1254-59

However, as noted in last week's report, any counter-trend moves are simply short-term up moves, as part of a larger reversal pattern towards the July lows.


Previous Weekly report


SPI Monthly and Weekly cycles

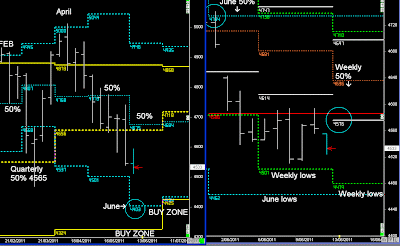
The SPI has moved down into the June lows @ 4460, whilst the S&P has moved down into it's own Support levels @ 1254/59.

Both markets have now the potential to rise upwards, as part of a short-term counter-trend move once price is above the Weekly levels.


However, any rise upwards will be seen as temporary, because trends that are rejected down from the 3rd month 50% level (June 50% level) will often extend towards lower lows into the following quarter.


And as we can see in the monthly cycles, there is still the potential to follow the trend towards lower lows.

SPI Primary cycles

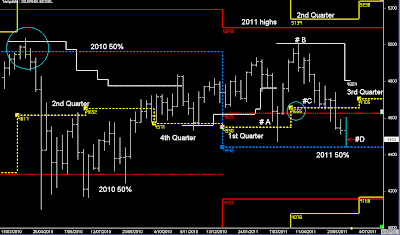
The Primary cycles in 2011 are similar to the price action in 2010; April highs and reversal patterns downward in the 2nd Quarter.

However, the larger cycles are different, as 2010 hit resistance, whilst this year the market has moved down into the 2011 support levels @ 4442....


Therefore there are two potential patterns based on the larger primary cycles.....

#1) This week's support @ 4460 sends the SPI back up towards the Quarterly 50% levels (3rd Quarter Yellow), and more sideways consolidation for the next 2-months

#2) Or the trend follows the monthly cycles lower, and finds support in the July lows, and then swings upwards into the 3rd Quarter 50% level.

At this stage the 3-Quarterly 50% level is seen as resistance, and likely consolidation pattern over the next 3-months

Aussie Index (SPI) 11th June 2011 Weekly

"markets can often come under selling pressure in the 3rd month of the Quarter if price is rejected from the monthly 50% level, and extend towards the following quarterly lows. Therefore the trend bias is to continue down into the June lows @ 4462, and then possibly extend towards the July lows

And if history repeats, then that's the level we should focus on in July, with the expectation that there will be Short-term counter-trend moves upwards until then"


SPI Monthly and Weekly cycles


The Trend has remained flat with a downward bias......


and as noted in last week's report.... if there is going to be a counter-trend move upwards, then is most likely going to align with the June lows @ 4460/62, and the S&P 500 finding support @ 1254-59 (US Index report)


However, as noted in last week's report, any counter-trend moves are simply short-term up moves, as part of a larger reversal pattern towards the July lows.


For those who subscribe to the definition of bear trends that is defined by the Primary timeframe, the current trend is trading below both the Yearly and Quarterly 50% levels.


Financial stocks have been in bear trends since early MAY, whilst resource stocks aren't, and they continue to remain above their own, namely BHP & RIO. (read the Stock Report)


Aussie Index (SPI) 4th June 2011 Weekly

The Weekly 50% level and June 50% level align as of next week...(Wednesday)

those levels will determine whether the trend moves upwards….
or is once again rejected back down from the monthly 50% level towards the June lows.


Previous Weekly report


SPI monthly and Weekly

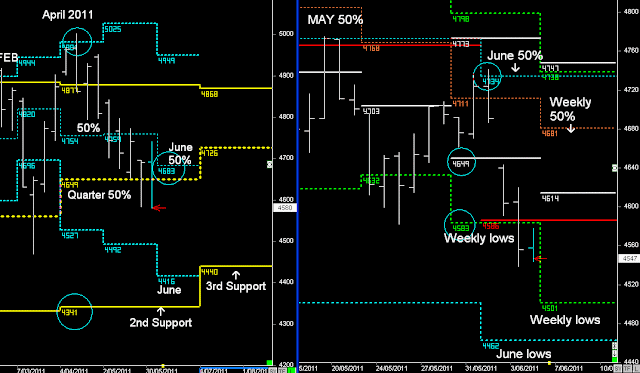
The market rose upwards until the start of June, and was then rejected down from the monthly 50% level, as the S&P 500 reversed down on the same day (read US market Report)

The critical support level in the short-term was 4581 Weekly lows, however, the support level was based on whether the S&P 500 would hold support @ 1301. And as we know that didn’t happen on Friday.

For those who have read my book, markets can often come under selling pressure in the 3rd month of the Quarter if price is rejected from the monthly 50% level, and extend towards the following quarterly lows. And as we can see, this is what is happening at the moment.


Therefore the trend bias is to continue down into the June lows @ 4462, and then possibly extend towards the July lows

There was a similar pattern in 2010, when markets reversed down from the April highs and continued towards the lower Quarterly support levels (Yellow)

In 2010, the lows in the market aligned precisely with the 3rd Quarter support (yellow) in July.

And if history repeats, then that's the level we should focus on in July, with the expectation that there will be Short-term counter-trend moves upwards until then.