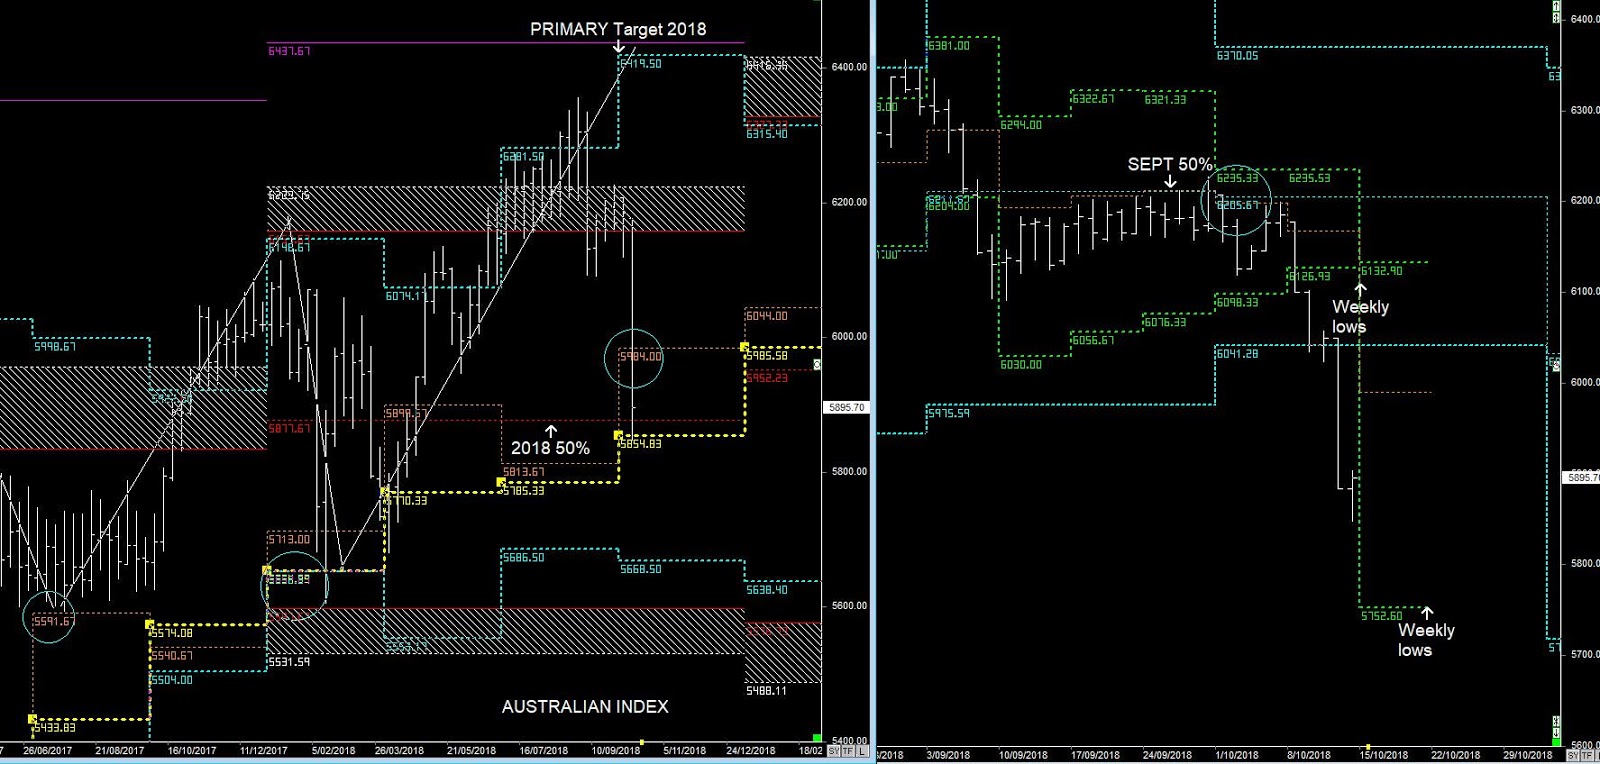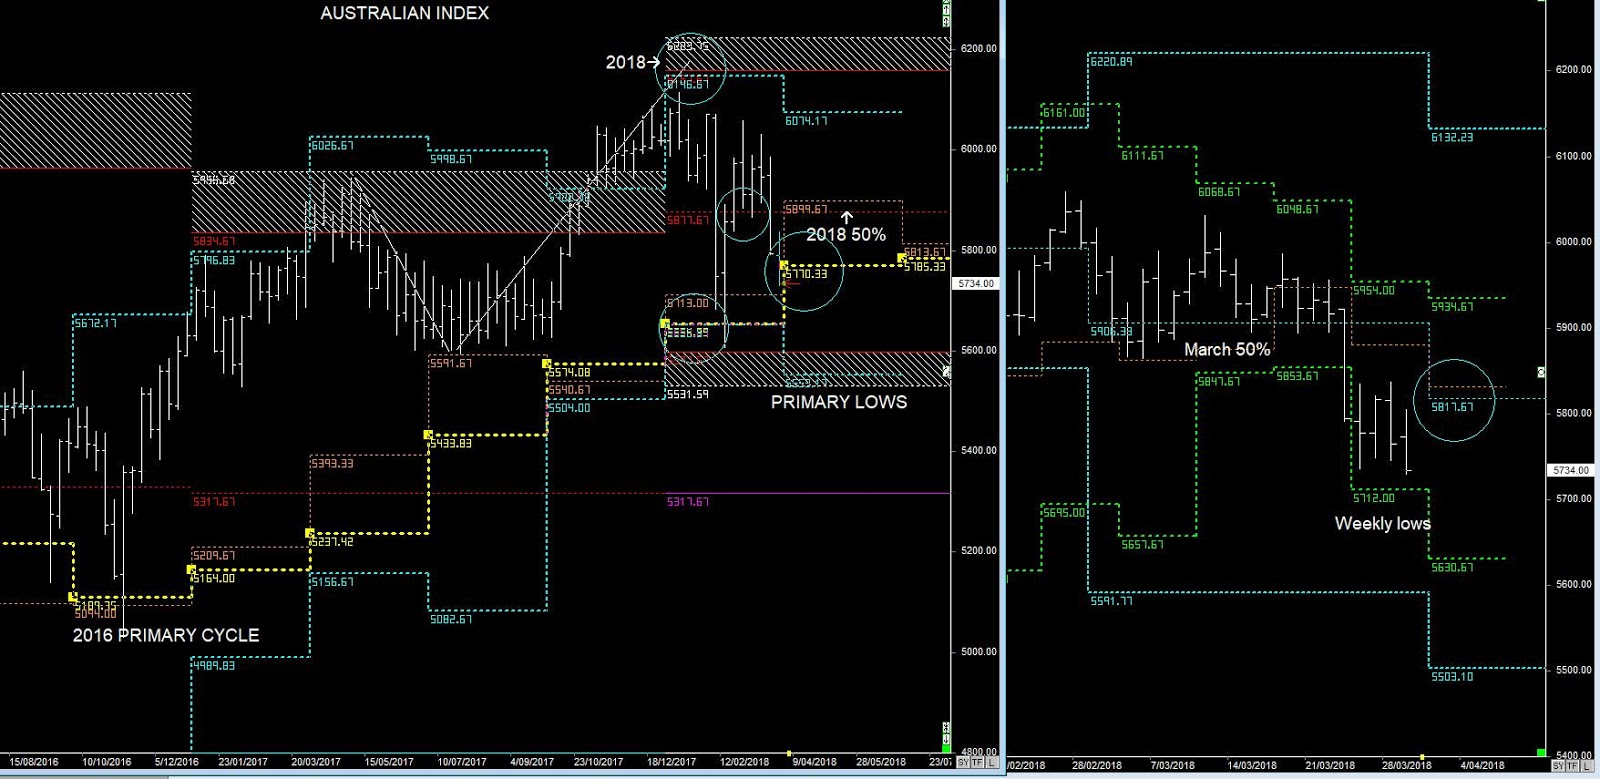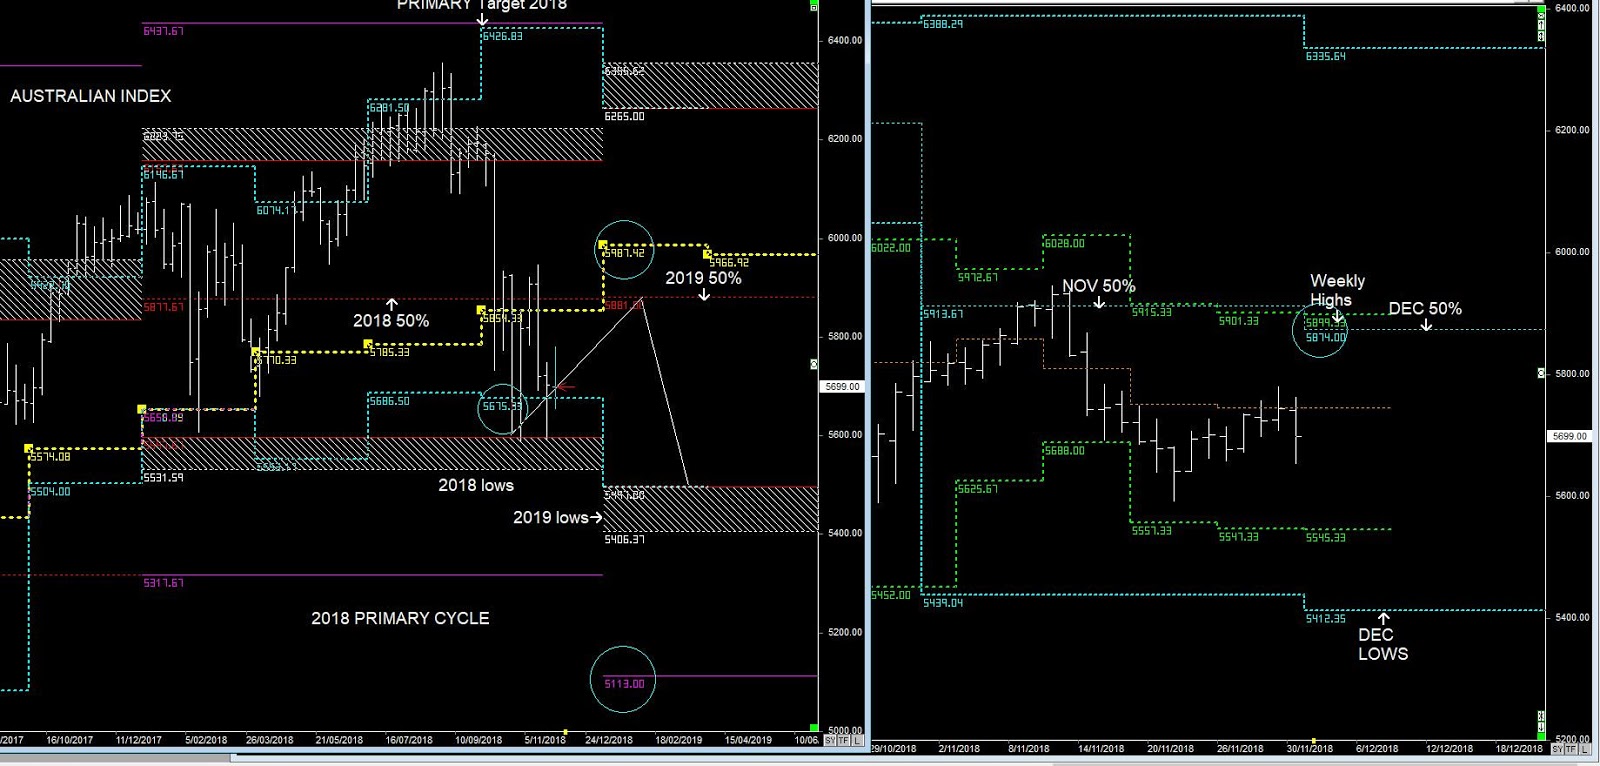
SPI Primary & Weekly Cycles
We can also see the Quarterly cycles bearish (below Yellow), whereas earlier in the year they were support.
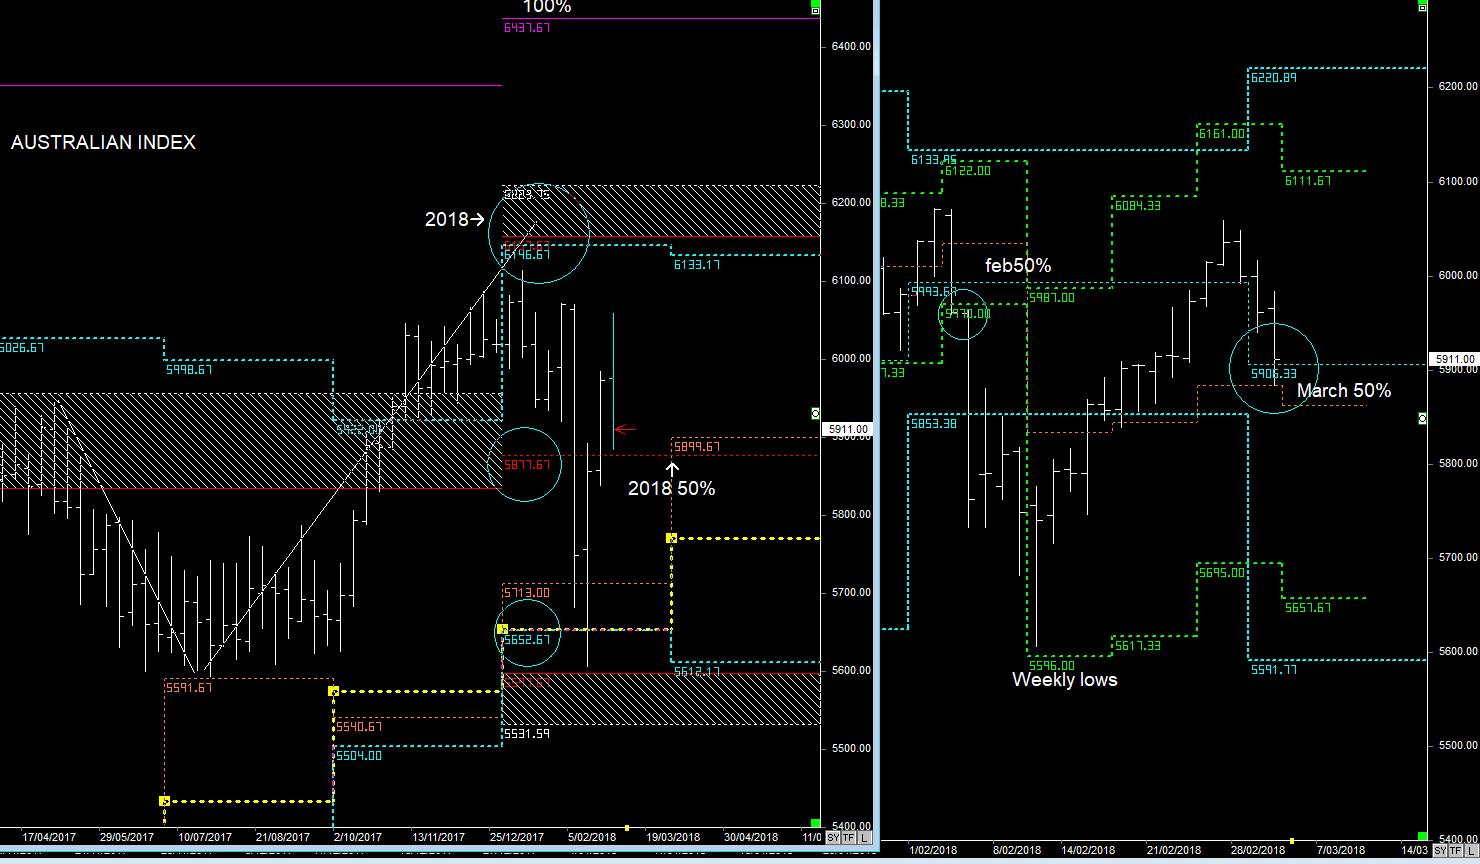
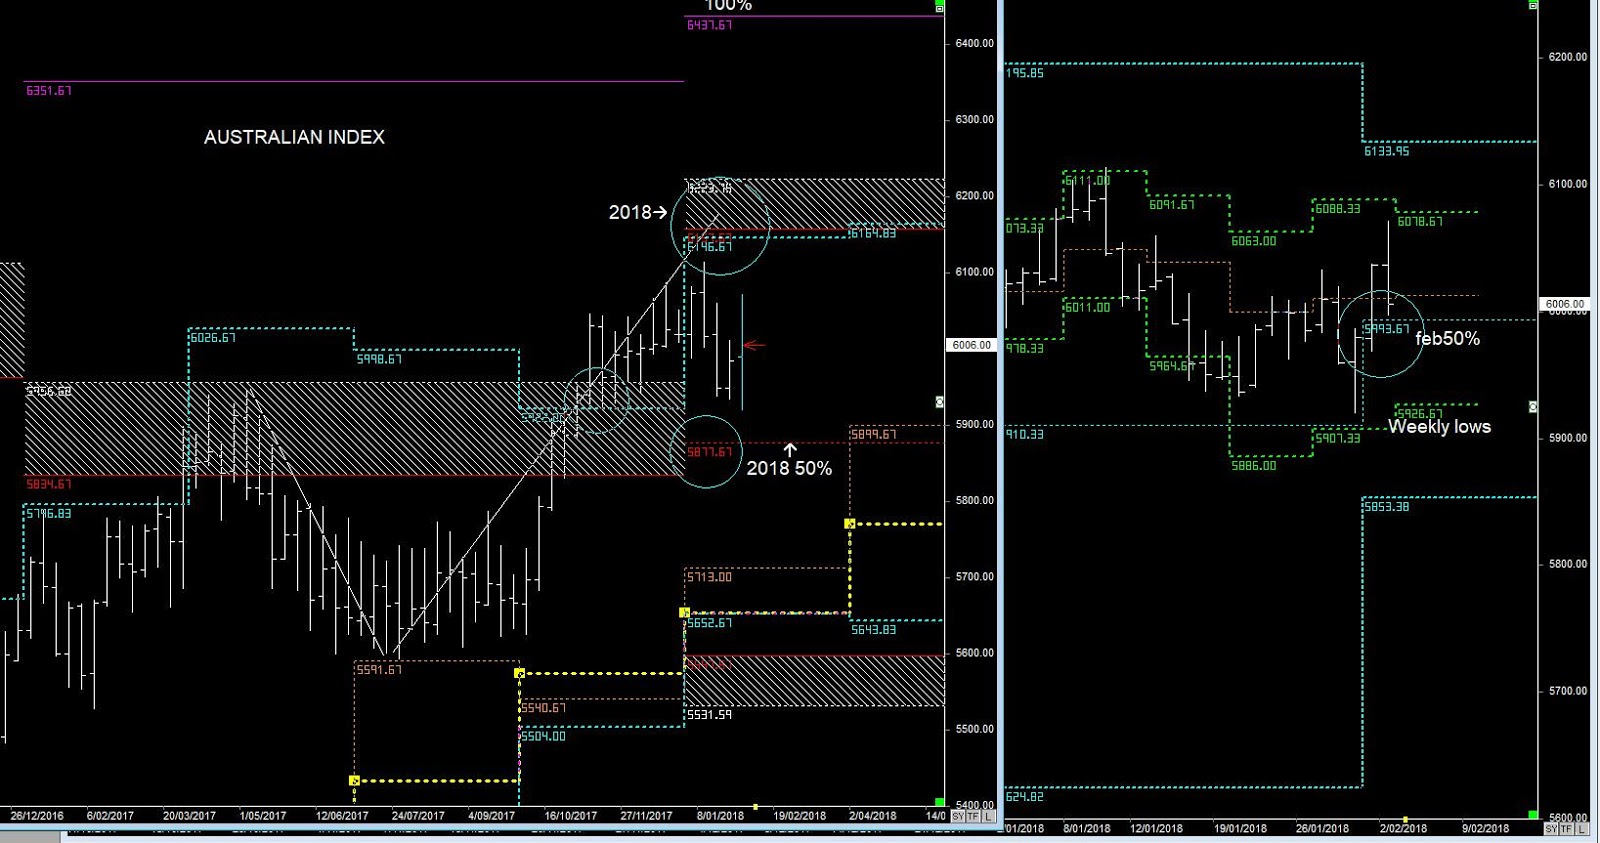
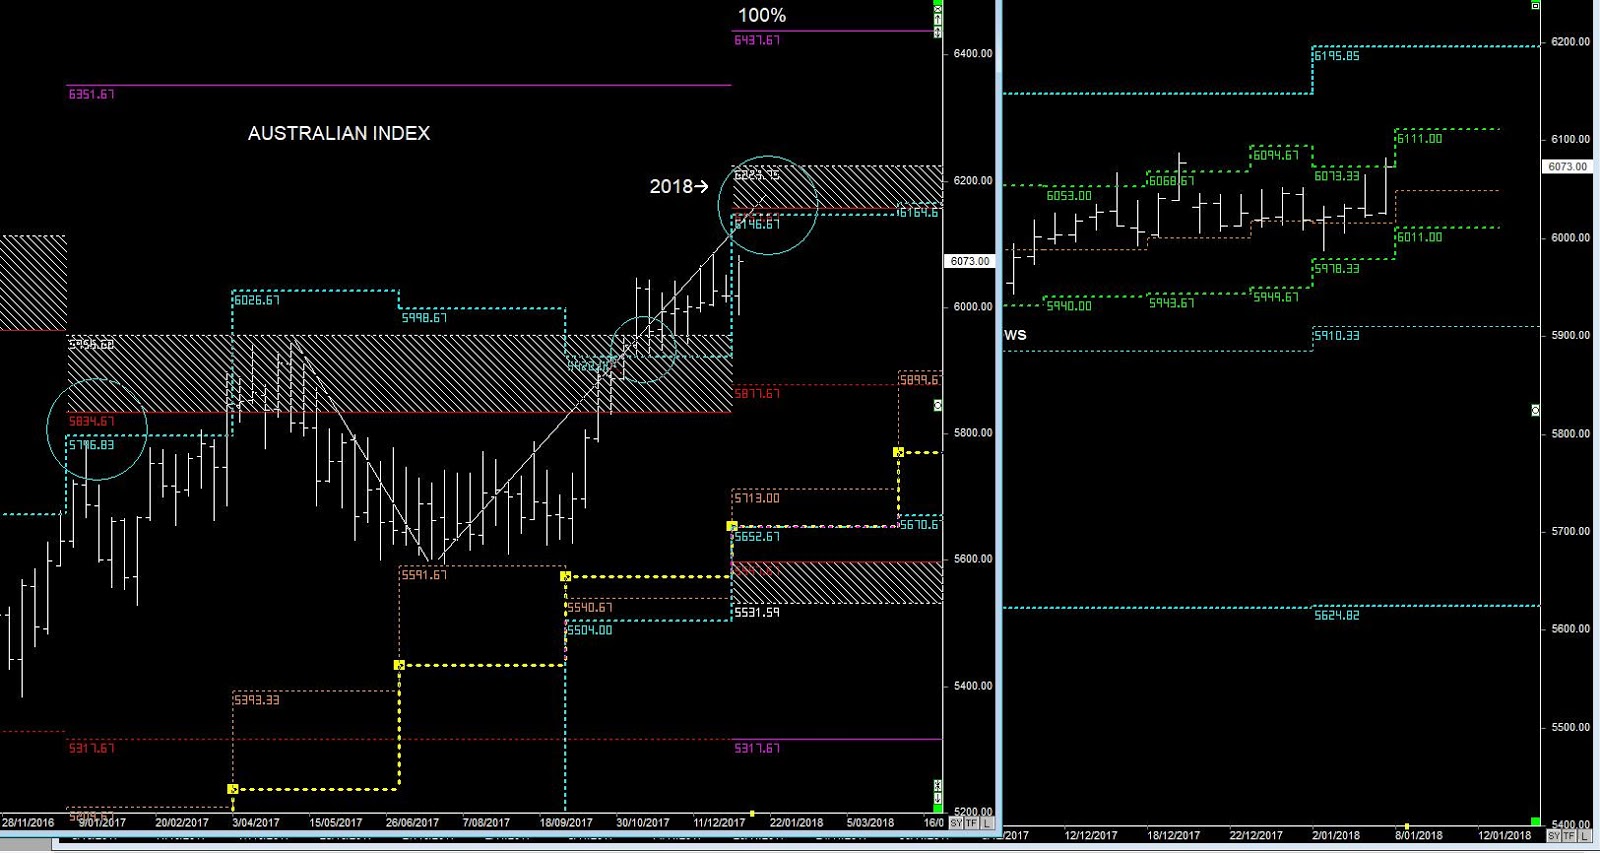
This now sets up the market being below the 2018 50% level and BEARISH PATTERNS that will go looking for 100% targets to the downside.
The Breakout of the October lows @ 6048 has put pressure on the market, but more importantly it's broken key levels in the Primary cycles and the bearish patterns have continued in November
(50% level resistance)
(50% level resistance)
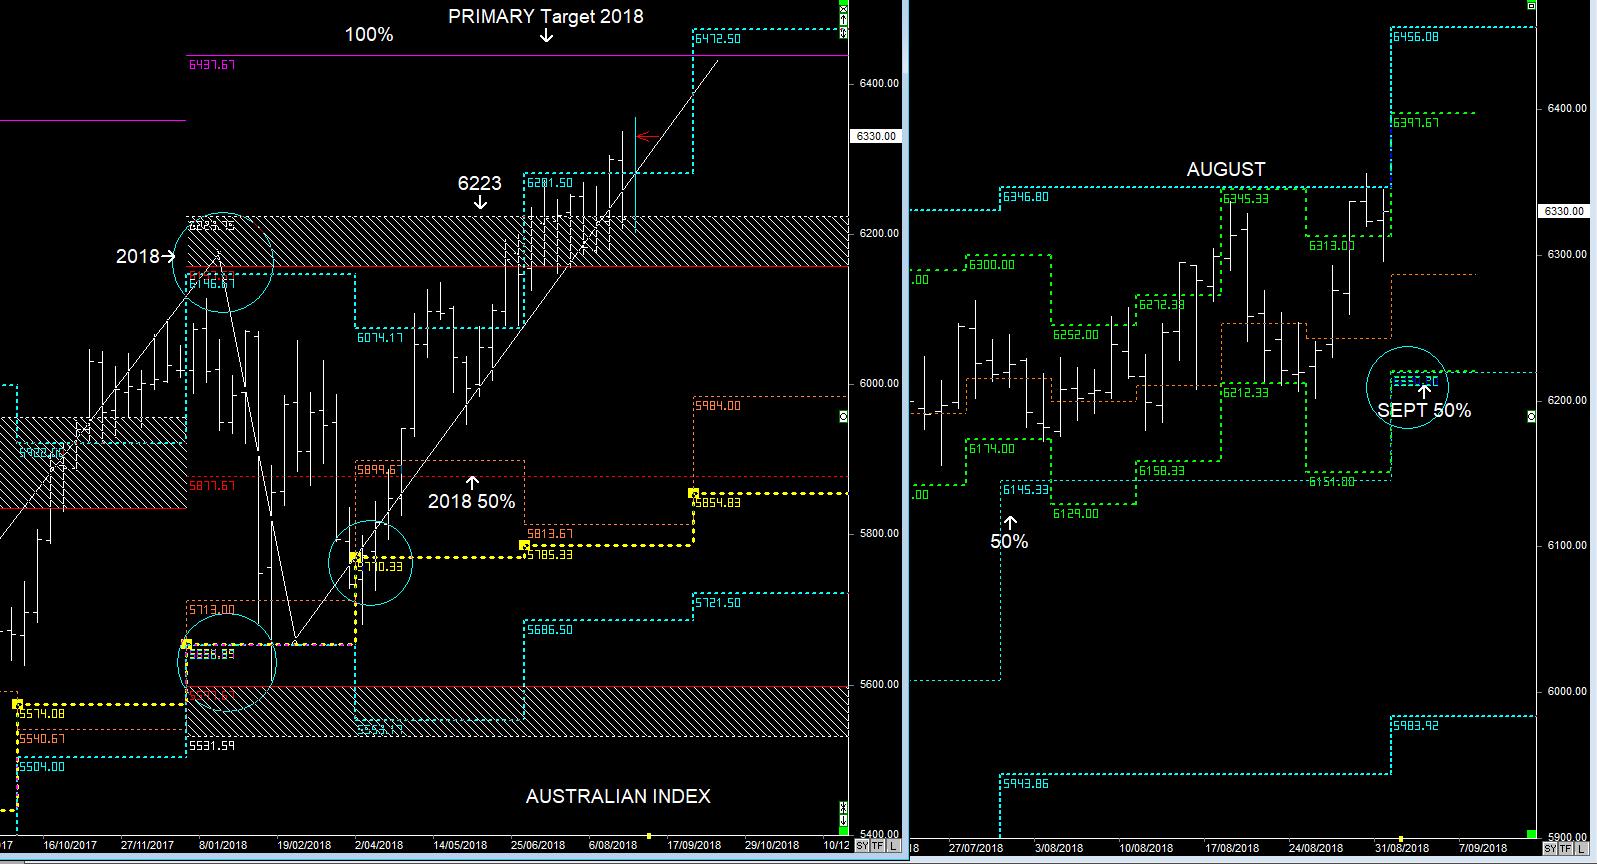
Whilst there is strength in the S&P 500 (sort of), the SPI should follow a 2-wave downside pattern towards the 2019 lows and as far as the 100% level @ 5113
I just can't see a December rally in the Australian market looking at these pattern.
There could be some upside, but only to retest resustance.
There could be some upside, but only to retest resustance.
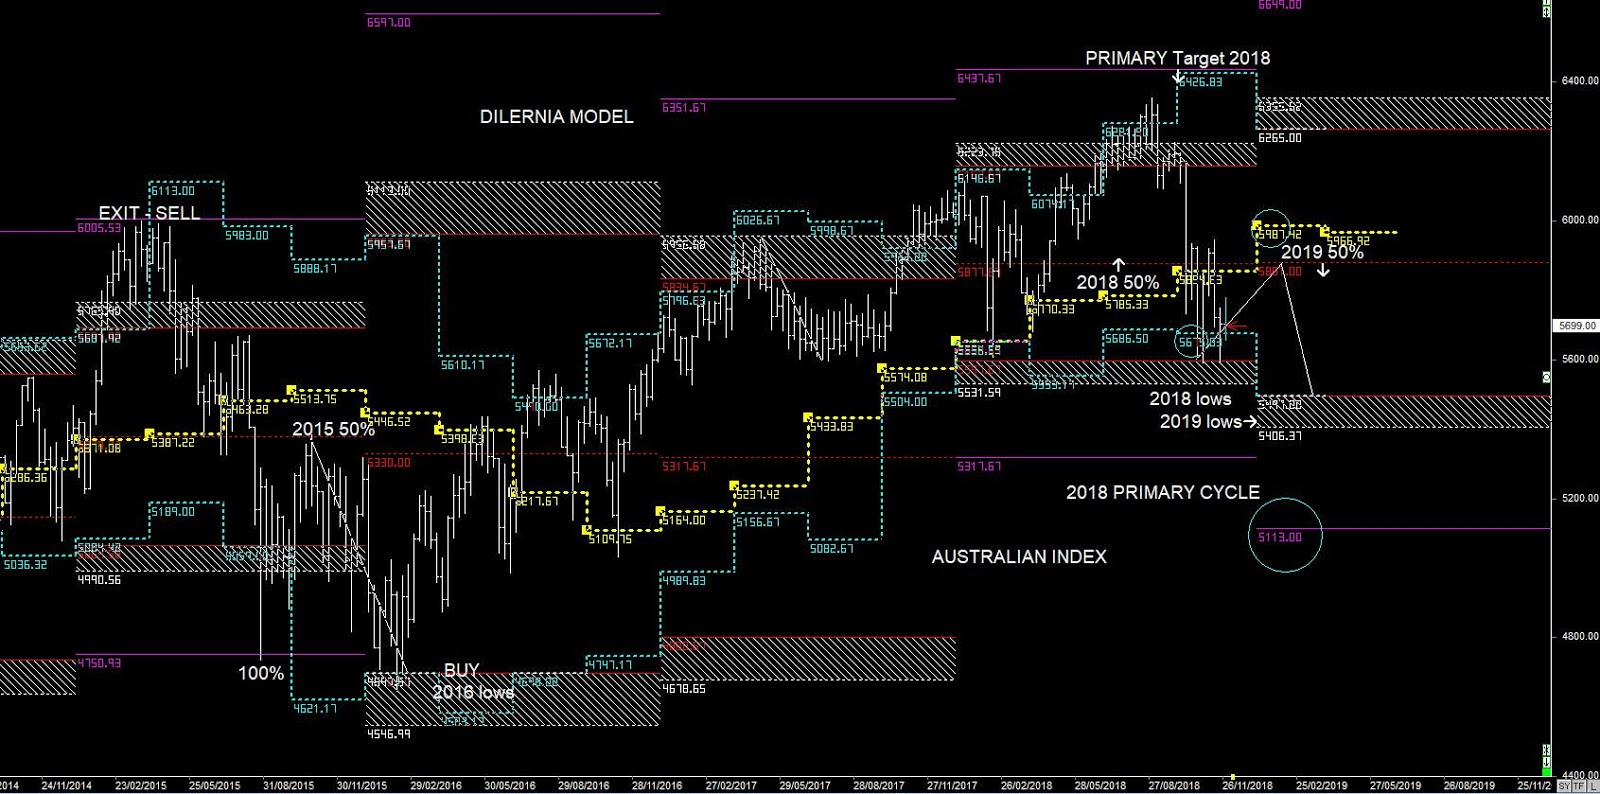
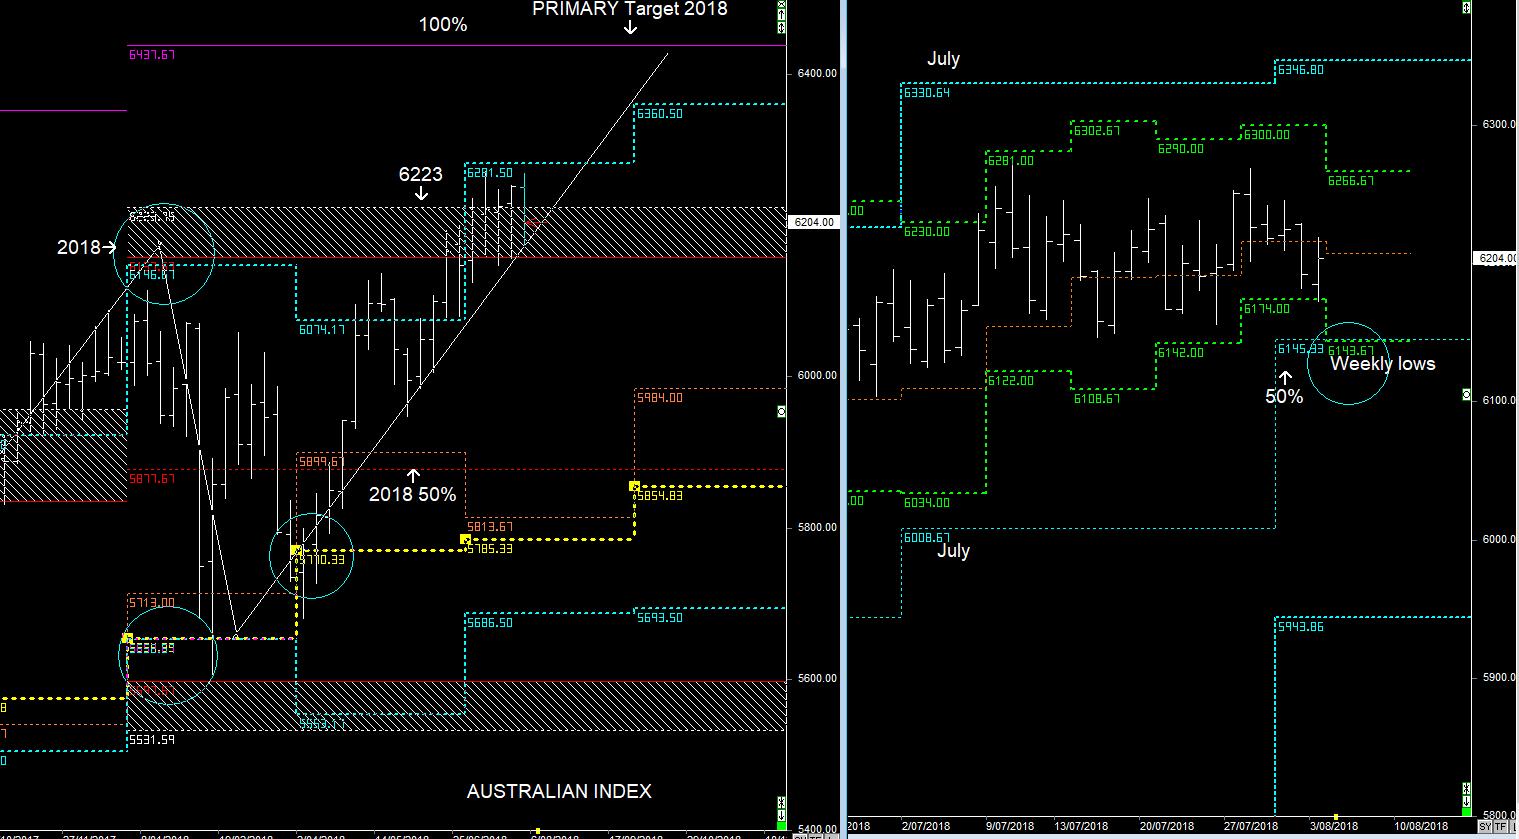
SPI PRIMARY CYCLES
This is a very similar pattern as in 2015-2016
Weakness in the 2nd half of 2015 and support in 2016 a continuation upwards.
12th SEPTEMBER 2015 REPORT
Therefore any short-term support must treat the 2015 50% as resistance for the rest of the year. (previous Report)
The Australian Market has continued its dramatic sell-off extending its low towards the 100% level of the Yearly Timeframe @ 4750
As noted in the previous report, the BEAR-Market pattern often extends towards the 2016 lows, If we use historical patterns clearly described in my book :- Market Trading Market Time, then we should see some consolidation around the current 2015 lows, but then further weakness from the 4th Quarter down into the 1st Quarter lows some time in March 2016
If that plays out, then I'd look to move back into Long positions in the Aussie Market 6 months from now using the 2016 lows and SUPPORT & ENTRY
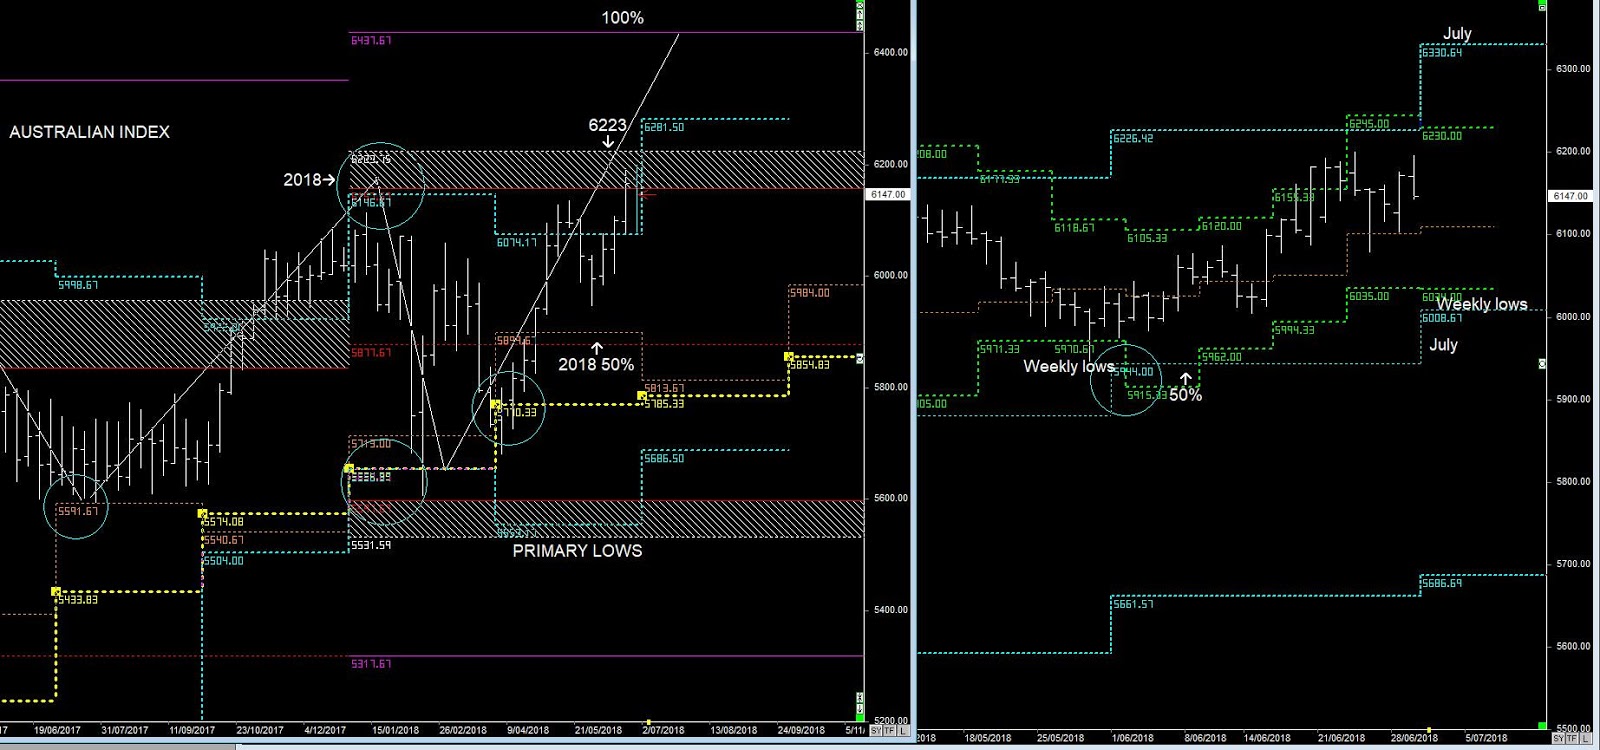
As you can see in the above post from September 2015, I had already had a vision how the market would act for the rest of the year and I was extremely confident that there would be further weakness in 2016 and that those lows would support the market.
I was confident because the MARKET had already extended itself 100% of the Primary range on the downside in 2015.
We haven't had that happen in 2018/2019, as yet.
So even though I've got an expectation that 2019 will push lower, I'm not as confident that 2019 will be as a robust support as 2016.