Aussie Index (SPI) 26 March 2011 Weekly

"Next Week's trend guide is the Weekly level @ 4646.

Potential swing is towards the Weekly 50% level @ 4740 to 4772."


Previous Weekly report

SPI Primary, Secondary & Intermediate Cycle

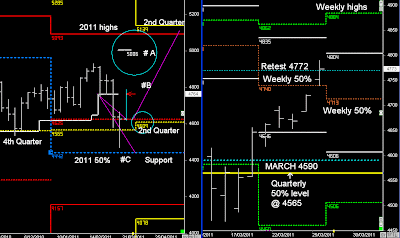
The SPI has reversed back into the Weekly 50% level and 4772.

As pointed out in the previous Weekly reports, I would treat this reversal pattern as hitting resistance and then continuing lower, towards a double monthly low pattern April, that aligns with the start of the 2nd Quarter

The current price action is a retest of breakout of the Weekly lows @ 4772 and also the Monthly 50% level, which on most occassions will push the market back down.

However, the price action in the S&P 500 on Thursday suggests more gains, which can push the Aussie market higher in the short-term, if it begins trading above 4804.

Otherwise, my view is that the SPI can remain within the Weekly levels (white) over the next 5-days until the start of the 2nd Quarter & April

As we can see in the Primary and Secondary cycles, the market has come down and retested the Yearly and Quarterly 50% levels, and is now pushing upwards. If we followed the cycles of retesting support and moving outward from these levels, the 2011 target remains the highs @ 5093.

Therefore the Aussie market is either going to continue to push upwards next week, or it's going to remain flat over the next 5-days within the Weekly levels until the start of the 2nd Quarter


READ US market report

Aussie Index (SPI) 19 March 2011 Weekly

" My view is that the market is going to swing back upwards and retest the Weekly breakout.

This will be resistance zone, that can send the market back downward
into the lows once again (April)

I would normally associate the current price action with another retest of the monthly lows in April, thus forming a double bottom before the market has the potential to move upwards
"


SPI Monthly and Weekly

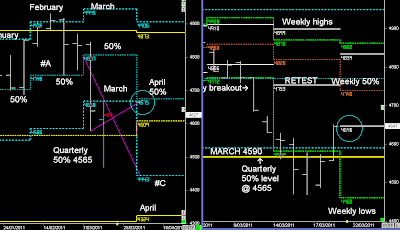
The SPI moved down into higher timeframe support levels @ 4565, but it took until Friday for the market to begin its swing upwards, as part of a move to retest last week's breakout of the Weekly lows

Next Week's trend guide is the Weekly level @ 4646.

Potential swing is towards the Weekly 50% level @ 4740 to 4772.

Note;- as mentioned in the previous Weekly report, there is the possibility that the market moves back down into April's lows using the April 50% level as the trend guide.

If the market struggles to rise upwards over the next 2-weeks, and using the higher timeframes 50% levels as a trend guide, we could see the market back around 4330.

Any weakness in the Australian market towards those lows will be influenced by continued weakness in the S&P 500

The Quarterly 50% levels (Yellow) are the critical support levels in the secondary cycles in the market

Aussie Index (SPI) 12 March 2011 Weekly

"Unless the SPI is below 4807, the upward trend remains stable.

Price has reversed down from the February highs (double monthly highs) and found support (February 50% level)

This would normally see the 3rd month continue up towards the following Quarterly highs in April, as part of a larger trend towards 5093, as previously mentioned

In the short-term, there is a gap at 4807, which matches critical levels in the SPI."


Last Week's report


SPI Monthly and Weekly

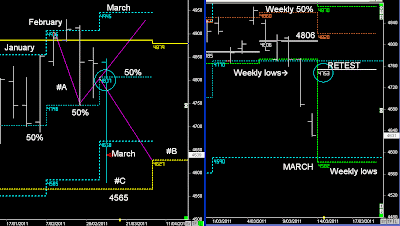
The risk of the upward trend began to falter by Tuesday once price started trading below 4807, and it was then confirmed with Thursday's breakout of the 3-week lows @ 4772, and the extension down into the MARCH lows.

Those lows @ 4590 were filled during Sycom trading.

My view from next week, is that the market is going to swing back towards 4730 to 4753 and retest the breakout.

Around 4753 is a potential resistance zone, that can send the market back downward into the lows once again

I would normally associate the current price action with another retest of the monthly lows in April, thus forming a double bottom before the market has the potential to move upwards.

If the S&P remains above it's support levels, then there's a potential rise upwards during the 2nd Quarter starting in April.

If the S&P fails support levels, then there is a larger reversal pattern taking place.... (read Below)


SPI Primary & Secondary cycles, along with the Monthly Range

The SPI is now following Set-up B or C.

The Price action in February was following Set-up A;- a bounce off the monthly 50% level, and whilst above 4807 the bias was to follow the trend towards the 2nd Quarter highs @ 5093-96.

That changed this week, with the market failing to remain above 4807, followed by the breakout of the Weekly lows @ 4772, and the continuation down towards the March lows

There are now two larger reversal patterns playing out…

#B) Has reached support and now rises upwards in the short-term, but then forms a double monthly low pattern in April.

The next upward trend aligns with the 2nd quarterly 50% level (Yellow)

#C) Support fails in the S&P 500 and the SPI continues to trend down towards 4442


Read US Index Report

Aussie Index (SPI) 5 March 2011 Weekly

SPI Monthly and Weekly

At the moment I'm treating the Aussie Market using orderly patterns with an upward bias in MARCH and APRIL.

The view is that most stocks have reversed down from their February highs (double monthly highs) and found support.

This would normally see the 3rd month continue up towards the following Quarterly highs in April, as part of a larger trend towards 5093, as previously mentioned

In the short-term, there is a gap at 4807, which matches critical levels in the SPI....

the Weekly level and the March 50% level @ 4806-07

Once again, my view of the trend moving higher is going to be determined by the price action in US markets, as was the case last week, when we saw early weakness in the S&P 500 during the first 2-days, as the market reversed down into critical support levels.

Unless the S&P 500 is trading below 1300 (& March 50% level), and the SPI is below 4807, then the trend is remains stable.

This stability is now based on US markets.

READ US Index report